Porsche 2012 Annual Report Download - page 177
Download and view the complete annual report
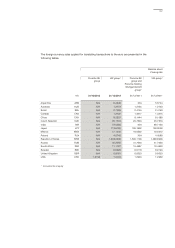
Please find page 177 of the 2012 Porsche annual report below. You can navigate through the pages in the report by either clicking on the pages listed below, or by using the keyword search tool below to find specific information within the annual report.-
 1
1 -
2
-
3
-
4
-
5
-
6
-
7
-
8
-
9
-
10
-
11
-
12
-
13
-
14
-
15
-
16
-
17
-
18
-
19
-
20
-
21
-
22
-
23
-
24
-
25
-
26
-
27
-
28
-
29
-
30
-
31
-
32
-
33
-
34
-
35
-
36
-
37
-
38
-
39
-
40
-
41
-
42
-
43
-
44
-
45
-
46
-
47
-
48
-
49
-
50
-
51
-
52
-
53
-
54
-
55
-
56
-
57
-
58
-
59
-
60
-
61
-
62
-
63
-
64
-
65
-
66
-
67
-
68
-
69
-
70
-
71
-
72
-
73
-
74
-
75
-
76
-
77
-
78
-
79
-
80
-
81
-
82
-
83
-
84
-
85
-
86
-
87
-
88
-
89
-
90
-
91
-
92
-
93
-
94
-
95
-
96
-
97
-
98
-
99
-
100
-
101
-
102
-
103
-
104
-
105
-
106
-
107
-
108
-
109
-
110
-
111
-
112
-
113
-
114
-
115
-
116
-
117
-
118
-
119
-
120
-
121
-
122
-
123
-
124
-
125
-
126
-
127
-
128
-
129
-
130
-
131
-
132
-
133
-
134
-
135
-
136
-
137
-
138
-
139
-
140
-
141
-
142
-
143
-
144
-
145
-
146
-
147
-
148
-
149
-
150
-
151
-
152
-
153
-
154
-
155
-
156
-
157
-
158
-
159
-
160
-
161
-
162
-
163
-
164
-
165
-
166
-
 167
167 -
 168
168 -
 169
169 -
 170
170 -
 171
171 -
 172
172 -
 173
173 -
 174
174 -
 175
175 -
 176
176 -
 177
177 -
 178
178 -
 179
179 -
 180
180 -
 181
181 -
 182
182 -
 183
183 -
 184
184 -
 185
185 -
 186
186 -
 187
187 -
188
-
189
-
190
-
191
-
192
-
193
-
194
-
195
-
196
-
197
-
198
-
199
-
200
-
201
-
202
-
203
-
204
-
205
-
206
-
207
-
208
-
209
-
210
-
211
-
212
-
213
-
214
-
215
-
216
-
217
-
218
-
219
-
220
-
221
-
222
-
223
-
224
-
225
-
226
-
227
-
228
-
229
-
230
-
231
-
232
-
233
-
234
-
235
-
236
-
237
-
238
-
239
-
240
-
241
-
242
-
243
-
244
-
245
-
246
-
247
-
248
-
249
-
250
-
251
-
252
-
253
-
254
-
255
-
256
-
257
-
258
-
259
-
260
-
261
-
262
-
263
-
264
-
265
-
266
-
267
-
268
-
269
-
270
 |
 |

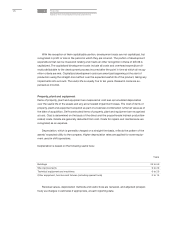
Any impairment losses or reversals of impairment losses are recognized through profit or
loss in the item amortization of intangible assets and depreciation of property, plant and equip-
ment, leased assets and investment property.
Investment property
Investment property held to generate rental income is accounted for at depreciated cost. The
underlying useful lives and depreciation methods used in subsequent measurement correspond
to those applied for items of property, plant and equipment used by the group.
Other receivables and financial assets
Other receivables and financial assets (excluding derivative financial instruments) are accounted
for at amortized cost. Appropriate allowance is made for known individual risks and general
credit risks.
Inventories
Inventories are stated at the lower of cost or net realizable value as of the reporting date.
The cost of inventories comprises all costs of purchase and other costs incurred in bringing
the inventories to their present location and condition. In addition to costs directly attributable,
the costs of conversion of the internally produced goods include an appropriate portion of in-
curred materials and production overheads as well as production-related depreciation and other
directly attributable costs.
Net realizable value is the estimated selling price in the ordinary course of business less the
estimated costs of completion and the estimated costs necessary to make the sale.
If the carrying amounts are no longer realizable due to a decrease in prices in the sales market,
inventories are written down accordingly.
Inventories of similar nature are generally measured using the weighted average cost method.
Long-term development contracts
Future receivables from long-term development contracts are recognized according to their per-
centage of completion. The percentage of completion to be recognized per contract is calculated
by comparing the accumulated costs with the total costs expected (cost-to-cost method). If the
result of a development contract cannot be determined reliably, income is only recognized at the
173