Porsche 2011 Annual Report Download - page 178
Download and view the complete annual report
Please find page 178 of the 2011 Porsche annual report below. You can navigate through the pages in the report by either clicking on the pages listed below, or by using the keyword search tool below to find specific information within the annual report.-
 1
1 -
2
-
3
-
4
-
5
-
6
-
7
-
8
-
9
-
10
-
11
-
12
-
13
-
14
-
15
-
16
-
17
-
18
-
19
-
20
-
21
-
22
-
23
-
24
-
25
-
26
-
27
-
28
-
29
-
30
-
31
-
32
-
33
-
34
-
35
-
36
-
37
-
38
-
39
-
40
-
41
-
42
-
43
-
44
-
45
-
46
-
47
-
48
-
49
-
50
-
51
-
52
-
53
-
54
-
55
-
56
-
57
-
58
-
59
-
60
-
61
-
62
-
63
-
64
-
65
-
66
-
67
-
68
-
69
-
70
-
71
-
72
-
73
-
74
-
75
-
76
-
77
-
78
-
79
-
80
-
81
-
82
-
83
-
84
-
85
-
86
-
87
-
88
-
89
-
90
-
91
-
92
-
93
-
94
-
95
-
96
-
97
-
98
-
99
-
100
-
101
-
102
-
103
-
104
-
105
-
106
-
107
-
108
-
109
-
110
-
111
-
112
-
113
-
114
-
115
-
116
-
117
-
118
-
119
-
120
-
121
-
122
-
123
-
124
-
125
-
126
-
127
-
128
-
129
-
130
-
131
-
132
-
133
-
134
-
135
-
136
-
137
-
138
-
139
-
140
-
141
-
142
-
143
-
144
-
145
-
146
-
147
-
148
-
149
-
150
-
151
-
152
-
153
-
154
-
155
-
156
-
157
-
158
-
159
-
160
-
161
-
162
-
163
-
164
-
165
-
166
-
167
-
 168
168 -
 169
169 -
 170
170 -
 171
171 -
 172
172 -
 173
173 -
 174
174 -
 175
175 -
 176
176 -
 177
177 -
 178
178 -
 179
179 -
 180
180 -
 181
181 -
 182
182 -
 183
183 -
 184
184 -
 185
185 -
 186
186 -
 187
187 -
 188
188 -
189
-
190
-
191
-
192
-
193
-
194
-
195
-
196
-
197
-
198
-
199
-
200
-
201
-
202
-
203
-
204
-
205
-
206
-
207
-
208
-
209
-
210
-
211
-
212
-
213
-
214
-
215
-
216
-
217
-
218
-
219
-
220
-
221
-
222
-
223
-
224
-
225
-
226
-
227
-
228
-
229
-
230
-
231
-
232
-
233
-
234
-
235
-
236
-
237
-
238
-
239
-
240
 |
 |

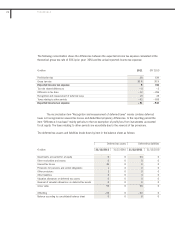
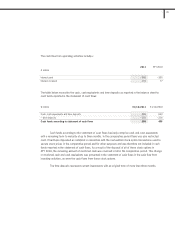
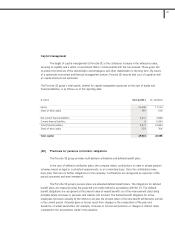
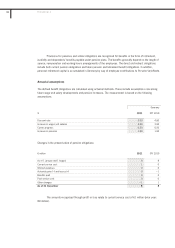
The following reconciliation shows the differences between the expected income tax expense calculated at the
theoretical group tax rate of 30% (prior year: 30%) and the actual reported income tax expense:
The reconciliation item “Recognition and measurement of deferred taxes” mainly contains deferred
taxes not recognized on unused tax losses and deductible temporary differences. In the reporting period the
item “Difference in tax base” mainly pertains to the tax exemption of profit/loss from investments accounted
for at equity. The taxes relating to other periods are essentially due to the reversal of tax provisions.
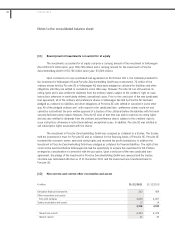
The deferred tax assets and liabilities break down by item in the balance sheet as follows:
€ million 2011 SFY 2010
Profit before tax 28 639
Group tax rate 30 % 30 %
Expected income tax expense 8 192
Tax rate related differences – 4 – 2
Difference in tax base – 12 – 206
Recognition and measurement of deferred taxes 19 28
Taxes relating to other periods – 42 – 659
Reported income tax expense – 31 – 647
Deferred tax assets Deferred tax liabilities
€ million 31/12/2011 31/12/2010 31/12/2011 31/12/2010
Investments accounted for at equity 0 0 54 0
Other receivables and assets 0 0 0 0
Unused tax losses 46 0 0 0
Provisions for pensions and similar obligations 1 0 0 0
Other provisions 3 0 0 0
Other liabilities 0 0 4 0
Valuation allowances on deferred tax assets 0 0 0 0
Reversal of valuation allowances on deferred tax assets 0 0 0 0
Gross value 50 0 58 0
Offsetting – 50 0 – 50 0
Balance according to consolidated balance sheet 0 0 8 0
178 FINANCIALS