Porsche 2004 Annual Report Download - page 107
Download and view the complete annual report
Please find page 107 of the 2004 Porsche annual report below. You can navigate through the pages in the report by either clicking on the pages listed below, or by using the keyword search tool below to find specific information within the annual report.-
 1
1 -
2
-
3
-
4
-
5
-
6
-
7
-
8
-
9
-
10
-
11
-
12
-
13
-
14
-
15
-
16
-
17
-
18
-
19
-
20
-
21
-
22
-
23
-
24
-
25
-
26
-
27
-
28
-
29
-
30
-
31
-
32
-
33
-
34
-
35
-
36
-
37
-
38
-
39
-
40
-
41
-
42
-
43
-
44
-
45
-
46
-
47
-
48
-
49
-
50
-
51
-
52
-
53
-
54
-
55
-
56
-
57
-
58
-
59
-
60
-
61
-
62
-
63
-
64
-
65
-
66
-
67
-
68
-
69
-
70
-
71
-
72
-
73
-
74
-
75
-
76
-
77
-
78
-
79
-
80
-
81
-
82
-
83
-
84
-
85
-
86
-
87
-
88
-
89
-
90
-
91
-
92
-
93
-
94
-
95
-
96
-
 97
97 -
 98
98 -
 99
99 -
 100
100 -
 101
101 -
 102
102 -
 103
103 -
 104
104 -
 105
105 -
 106
106 -
 107
107 -
 108
108 -
 109
109 -
 110
110 -
 111
111 -
 112
112 -
 113
113 -
 114
114 -
 115
115 -
 116
116 -
 117
117 -
118
-
119
-
120
-
121
-
122
-
123
-
124
-
125
-
126
-
127
-
128
-
129
-
130
-
131
-
132
-
133
-
134
-
135
-
136
-
137
-
138
-
139
-
140
-
141
-
142
-
143
-
144
-
145
-
146
-
147
-
148
-
149
-
150
-
151
-
152
-
153
-
154
-
155
-
156
-
157
-
158
-
159
-
160
-
161
-
162
-
163
-
164
-
165
-
166
-
167
-
168
 |
 |

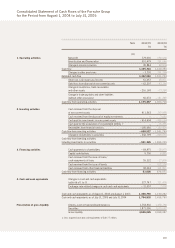
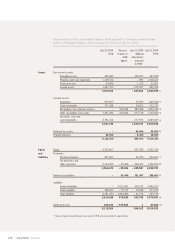
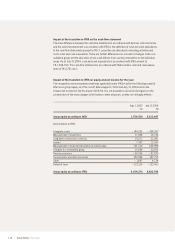
Consolidated Statement of Cash Flows of the Porsche Group
for the Period from August 1, 2004 to July 31, 2005
Note 2004/05 2003/04
T€ T€
(11)
Net profit 779,000 690,000
Amortization and Depreciation 510,479 381,546
Change in pension provision 45,844 48,804
Cash flow 1,335,323 1,120,350
Changes in other provisions – 3,230 391,384
Extended cash flow 1,332,093 1,511,734
Other non-cash expenses/income 61,657 49,911
Gain/loss from disposal of non-current assets – 62,207 – 43,194
Change in inventories, trade receivables
and other assets – 216,168 –73,384
Change in trade payables and other liabilities
(without other provisions) 60,072 – 141,349
Cash flow from operating activities 1,175,447 1,303,718
Cash received from the disposal
of non-current assets 411,563 367,988
Cash received from the disposal of equity investments – 7,680
Cash paid for investments in non-current assets – 914,404 – 960,664
Cash paid for the acquisition of consolidated entities 1) –– 76,355
Receivables from financial services –185,686 – 380,434
Cash flow from investing activities – 688,527 – 1,041,785
Change in investments in securities – 242,799 – 826,554
Cash flow from investing activities
including investments in securities – 931,326 – 1,868,339
Cash payments to shareholders – 69,475 – 58,975
Capital contributions 5,706 8,885
Cash received from the issue of loans/
cash repayments of loans 55,332 – 27,959
Cash received from the issue of bonds – 632,309
Cash received from other financial liabilities 92,063 321,811
Cash flow from financing activities 83,626 876,071
Changes in cash and cash equivalents
(subtotal of 1 to 3) 327,747 311,450
Exchange-rate related changes in cash and cash equivalents – 31,607 7,058
Cash and cash equivalents as of August 1, 2004 and August 1, 2003 1,458,790 1,140,282
Cash and cash equivalents as of July 31, 2005 and July 31, 2004 1,754,930 1,458,790
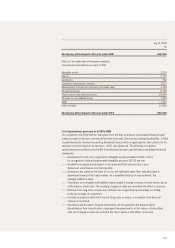
Checks, cash on hand and bank balances 1,754,930 1,458,790
Securities 1,871,096 1,610,597
Gross liquidity 3,626,026 3,069,387
1) Less acquired cash and cash equivalents of EUR 7.7 million.
1. Operating activities
2. Investing activities
3. Financing activities
4. Cash and cash equivalents
Presentation of gross liquidity
103Konzernanhang