Pitney Bowes 2005 Annual Report Download - page 34
Download and view the complete annual report
Please find page 34 of the 2005 Pitney Bowes annual report below. You can navigate through the pages in the report by either clicking on the pages listed below, or by using the keyword search tool below to find specific information within the annual report.-
 1
1 -
2
-
3
-
4
-
5
-
6
-
7
-
8
-
9
-
10
-
11
-
12
-
13
-
14
-
15
-
16
-
17
-
18
-
19
-
20
-
21
-
22
-
23
-
 24
24 -
 25
25 -
 26
26 -
 27
27 -
 28
28 -
 29
29 -
 30
30 -
 31
31 -
 32
32 -
 33
33 -
 34
34 -
 35
35 -
 36
36 -
 37
37 -
 38
38 -
 39
39 -
 40
40
 |
 |

32
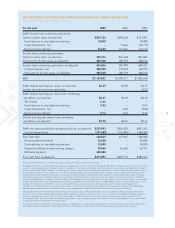
For the year 2005 2004 2003
As reported
Revenue $5,492,183 $4,957,440 $4,576,853
Income from continuing operations $526,578 $480,526 $494,847
Diluted earnings per share from continuing operations $2.27 $2.05 $2.10
Cash provided by operating activities $539,593 $944,639 $851,261
Depreciation and amortization $331,963 $306,750 $288,808
Capital expenditures $291,550 $316,982 $285,681
Cash dividends per share of common stock $1.24 $1.22 $1.20
Average common shares outstanding 231,771,812 234,133,211 236,165,024
Total assets $10,621,382 $10,211,626 $8,891,388
Total debt $4,710,019 $4,380,010 $3,573,784
Stockholders’ equity $1,301,941 $1,290,081 $1,087,362
Total employees 34,165 35,183 32,474
As adjusted*
EBIT $1,139,032 $1,050,217 $1,006,260
Income from continuing operations $624,826 $593,999 $569,471
Diluted earnings per share from continuing operations $2.70 $2.54 $2.41
Free cash flow $613,095 $693,712 $688,331
EBIT to interest 5.5x 6.1x 6.0x
Summary of Selected Financial Data
Dollars in thousands, except per share amounts
*Please refer to page 33 for a discussion on the presentation of adjusted financial results and a reconciliation of adjusted results to results reported in
accordance with generally accepted accounting principles (GAAP).