Pentax 2010 Annual Report Download - page 36
Download and view the complete annual report
Please find page 36 of the 2010 Pentax annual report below. You can navigate through the pages in the report by either clicking on the pages listed below, or by using the keyword search tool below to find specific information within the annual report.-
 1
1 -
2
-
3
-
4
-
5
-
6
-
7
-
8
-
9
-
10
-
11
-
12
-
13
-
14
-
15
-
16
-
17
-
18
-
19
-
20
-
21
-
22
-
23
-
24
-
25
-
 26
26 -
 27
27 -
 28
28 -
 29
29 -
 30
30 -
 31
31 -
 32
32 -
 33
33 -
 34
34 -
 35
35 -
 36
36 -
 37
37 -
 38
38 -
 39
39 -
 40
40 -
 41
41 -
 42
42 -
 43
43 -
 44
44 -
 45
45 -
 46
46 -
47
-
48
-
49
-
50
-
51
-
52
-
53
 |
 |

divisions and others applied impairment accounting, resulting in an impairment loss of ¥30,458
million.
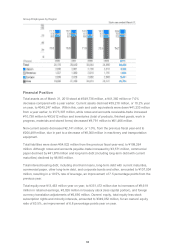
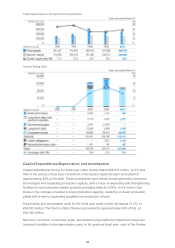
Capital Expenditure/Depreciation and Amortization
Cash Flows
Net cash provided by operating activities amounted to ¥83,981 million, a decrease of ¥6,994
million from the previous fiscal year. The main positive factors were income before income
taxes and minority interests of ¥49,761 million (up ¥5,703 million year on year), depreciation
and amortization of ¥34,503 million (down ¥15,527 million), decrease in inventory of ¥9,990
million (up ¥3,750 million) and foreign currency loss of ¥6,975 million (up ¥15,007 million). The
main negative factors included an increase in notes and accounts receivable of ¥10,829 million
(up ¥41,372 million year on year), and ¥10,726 million in income taxes paid (down ¥24,264
million).
Net cash used in investing activities amounted to ¥40,723 million, an increase of ¥6,395 million
compared with the previous fiscal year. This was primarily attributable to payments of ¥26,650
million (down ¥7,523 million) for property, plant and equipment, centered on investments
related to next-generation products and increased production in the Electro-Optics Division.
Net cash used in financing activities amounted to ¥84,976 million, an increase of ¥79,176
million from the net cash used in the previous fiscal year. This was mainly due to a net
decrease of ¥41,978 million in commercial paper, and a total of ¥28,236 million in dividends
paid (an increase of ¥121 million year on year).
As a result of the above, the balance of cash and cash equivalents as of March 31, 2010, was
¥167,938 million, a decrease of ¥39,989 million.
Cash flow provided by operating activities
35