Omron 2013 Annual Report Download - page 12
Download and view the complete annual report
Please find page 12 of the 2013 Omron annual report below. You can navigate through the pages in the report by either clicking on the pages listed below, or by using the keyword search tool below to find specific information within the annual report.-
 1
1 -
 2
2 -
 3
3 -
 4
4 -
 5
5 -
 6
6 -
 7
7 -
 8
8 -
 9
9 -
 10
10 -
 11
11 -
 12
12 -
 13
13 -
 14
14 -
 15
15 -
 16
16 -
 17
17 -
 18
18 -
 19
19 -
 20
20 -
 21
21 -
 22
22 -
23
-
24
-
25
-
26
-
27
-
28
-
29
-
30
-
31
-
32
-
33
-
34
-
35
-
36
-
37
-
38
-
39
-
40
-
41
-
42
-
43
-
44
-
45
-
46
-
47
-
48
-
49
-
50
-
51
-
52
-
53
-
54
-
55
 |
 |

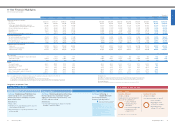
20 Omron Corporation Integrated Report 2013 21
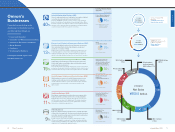
About Omron
Financial and Non-Financial Highlights
Net Sales and Operating Income
Ratio of Social Contribution Activity
Expenditures by Type (Fiscal 2012)
Earnings per Share (EPS) and
Price-Earnings Ratio (PER) CO2 Emissions Volumes
Cost Composition Occupational Accident Frequency
Capital Expenditures and
Cash Flows
Environmental Contribution
of Products and Services
Operating Income Margin
Ratio of Employees with Disabilities
to Total Employees
Net Sales per Employee Energy Usage
Net Income (Loss) Attributable to Shareholders
and Return on Shareholders’ Equity (ROE) Ratio of Participation in Human Rights Training
Cash Dividends per Share Employee Ratios (As of April 20, 2013)
0
150
300
450
600
750
08 09 10 1211
Cost of Sales SG&A Expenses
R&D Expenses Operating Income
(Billions of yen)
(FY)
–30
–15
0
30
15
45
60
–10
–5
0
5
15
10
20
Net Income (Loss) Attributable to Shareholders [left axis]
Return on Shareholders’ Equity (ROE) [right axis]
08 09 10 12
11
(Billions of yen) (%)
(FY)
0
15
30
45
60
08 09 10 12
11
Capital Expenditures
Cash Flows
(Billions of yen)
* Cash Flows = Net Income (Loss) Attributable
to Shareholders +
Depreciation & Amortization
(FY)
0
10
20
30
40
50
08 09 10 12
11
(Yen)
(FY)
0
30
60
90
120
150
0
30
60
90
120
150
08 09 10 12
11
Earnings per Share (EPS) [left axis]
Price-Earnings Ratio (PER) [right axis]
(Yen) (Times)
(FY)
0
1
2
3
4
08 09 10 12
11 (FY)
(%) (Japanese operations)
Omron Omron Group (Japan)
National Average (Japan)
0
0.4
0.2
0.6
0.8
1.0
08 09 10 12
11
Omron Group [Japan, left axis] Electric Equipment Manufacturing
Industry [left axis]
All Industries [right axis]
Frequency = ×1 Million Hours
Deaths Due to Accidents
Aggregate Work Hours
0
0.5
1.0
1.5
2.0
2.5
(FY)
(Frequency) (Japanese operations)
0
6,000
3,000
9,000
12,000
15,000
0
20
40
60
80
100
08 09 10 12
11
Japanese Group Employees [including temps, left axis]
Aggregate Training Hours [left axis] Ratio of Participation in Human
Rights Training [right axis]
(FY)
(People / hours) (%)
Female
20.6
Office Work
29.1
Production
21.5
Others
11.0
Type of
Job
(%)
Gender
(%)
Sales
16.5
Male
79.4
Research
21.9
(Japanese operations)
0
200
400
600
800
1,000
0
20
40
60
80
100
Net Sales [left axis]
(FY)
08 09 10 12
11
Operating Income [right axis]
(Billions of yen) (Billions of yen)
0
2
4
6
8
10
08 09 10 12
11 (FY)
(%)
0
5
10
15
25
20
08 09 10 12
11 (FY)
(Millions of yen)
0
40
80
120
160
200
0
1
2
3
4
5
CO2 Emissions Volumes [left axis]
Net Sales to CO2 Emissions [right axis]
10 11 12
* Net Sales to CO2 Emissions: Net Sales per Ton of CO2 emitted
(FY)
(Thousand t-CO2) (Million yen / t-CO2)
(Global production sites)
0
1,000
2,000
3,000
4,000
KeroseneDiesel OilFuel Oil ALPG
LNGCity Gas (13A)Electricity
10 11 12 (FY)
(TJ) (Global production sites)
0
100
200
300
400
10 11 12
* Environmental Contribution: Reduction in CO2 emissions resulting
from the use of Omron’s energy-saving or energy-creating products
(FY)
(Thousand t-CO2)
Voluntary Programs
85.5
International Exchange,
Environmental,
and Others
0.3
Culture and Arts
0.3
Social Welfare
2.0
Science and
Technologies
12.0 Type
(%)