Omron 2013 Annual Report Download - page 11
Download and view the complete annual report
Please find page 11 of the 2013 Omron annual report below. You can navigate through the pages in the report by either clicking on the pages listed below, or by using the keyword search tool below to find specific information within the annual report.-
 1
1 -
 2
2 -
 3
3 -
 4
4 -
 5
5 -
 6
6 -
 7
7 -
 8
8 -
 9
9 -
 10
10 -
 11
11 -
 12
12 -
 13
13 -
 14
14 -
 15
15 -
 16
16 -
 17
17 -
 18
18 -
 19
19 -
 20
20 -
 21
21 -
 22
22 -
23
-
24
-
25
-
26
-
27
-
28
-
29
-
30
-
31
-
32
-
33
-
34
-
35
-
36
-
37
-
38
-
39
-
40
-
41
-
42
-
43
-
44
-
45
-
46
-
47
-
48
-
49
-
50
-
51
-
52
-
53
-
54
-
55
 |
 |

18 Omron Corporation Integrated Report 2013 19
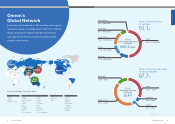
About Omron
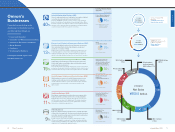
GLOBE STAGE
(FY2011 – FY2013)
Establishment of profi t and growth
structures on a global basis
• Sales: ¥710 billion
• Operating income:
¥58 billion
• Gross profi t margin: 39%
• Operating income
margin: 8.2%
EARTH STAGE
(FY2014 – FY2020)
New value generation for growth
• Sales: ¥1 trillion
• Operating income:
¥150 billion or higher
• Operating income
margin: 15% or higher
GOALS GOALS
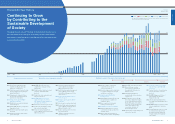
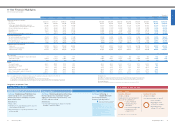
11-Year Financial Highlights
Omron Corporation and Subsidiaries
FY2001 – FY2003 FY2008 – FY2010FY2004 – FY2007 FY2011 – FY2020
2nd Stage Balancing Growth and Earnings
Reinforcing business foundations through
aggressive investment in growth areas, such
as M&A, and cost cutting
Achievement
• Increased EPS (Earnings per Share) from ¥110.7
(FY2003) to ¥185.9 (FY2007)
3rd Stage Achieving a
Growth Structure
Fortifi cation of growth
business (high profi tability)
Revival Stage
(February 2009 to March 2011)
• Emergency Measures
(Cost reduction target of approx. ¥63.0 billion achieved
in fi scal 2009)
14 months (February 2009 – March 2010)
• Structural Reform (Strengthening of profi t base
over the medium term) 26 months
• May 2010: Spun off the Automotive Electronic
Components Business
• April 2011: Spun off the Social Systems, Solutions
and Service Business
Revision of 3rd stage due to an abrupt
change in the business environment
1st Stage Establishing a Profi t Structure
Concentrating on cost structure reform
and restructuring the Company as a profi t-
generating business
Achievements
• ROE of 10%
• Withdrew from unprofi table business, spun off
of the Healthcare Business
• Raised the level of corporate governance to the
global standard
Long-term corporate vision
Millions of yen
Thousands of
U.S. dollars (Note 1)
FY2002 FY2003 FY2004 FY2005 FY2006 FY2007 FY2008 FY2009 FY2010 FY2011 FY2012 FY2012
Operating Results (for the year):
Net sales ¥522,535 ¥575,157 ¥598,727 ¥616,002 ¥723,866 ¥762,985 ¥627,190 ¥524,694 ¥617,825 ¥619,461 ¥650,461 $6,919,798
Gross profi t 201,816 235,460 245,298 232,667 278,241 293,342 218,522 184,342 231,702 227,887 241,507 2,569,223
Selling, general and administrative expenses
(excluding research and development expenses) 133,406 139,569 141,185 157,909 164,167 176,569 164,284 133,426 142,365 145,662 152,676 1,624,213
Research and development expenses 40,235 46,494 49,441 55,315 52,028 51,520 48,899 37,842 41,300 42,089 43,488 462,638
Operating income 28,175 49,397 54,672 60,782 62,046 65,253 5,339 13,074 48,037 40,136 45,343 482,372
EBITDA (Note 2) 57,851 77,059 83,314 91,607 95,968 101,596 38,835 40,088 71,021 62,753 67,795 721,223
Net income (loss) attributable to shareholders 511 26,811 30,176 35,763 38,280 42,383 (29,172) 3,518 26,782 16,389 30,203 321,309
Cash Flows (for the year):
Net cash provided by operating activities 41,854 80,687 61,076 51,699 40,539 68,996 31,408 42,759 41,956 31,946 53,058 564,447
Net cash used in investing activities (30,633) (34,484) (36,050) (43,020) (47,075) (36,681) (40,628) (18,584) (20,210) (26,486) (28,471) (302,883)
Free cash fl ow (Note 3) 11,221 46,203 25,026 8,679 (6,536) 32,315 (9,220) 24,175 21,746 5,460 24,587 261,564
Net cash provided by (used in) fi nancing activities (1,996) (28,119) (40,684) (38,320) (4,697) (34,481) 21,867 (20,358) 3,333 (33,492) (18,550) (197,339)
Financial Position (at year-end):
Total assets 567,399 592,273 585,429 589,061 630,337 617,367 538,280 532,254 562,790 537,323 573,637 6,102,521
Total interest-bearing liabilities 71,260 56,687 24,759 3,813 21,813 19,809 54,859 38,217 46,599 18,774 5,570 59,255
Total shareholders’ equity 251,610 274,710 305,810 362,937 382,822 368,502 298,411 306,327 312,753 320,840 366,962 3,903,851
Yen U.S. dollars (Note 1)
Per Share Data:
Net income (loss) attributable to shareholders (basic) 2.1 110.7 126.5 151.1 165.0 185.9 (132.2) 16.0 121.7 74.5 137.2 1.46
Shareholders’ equity 1,036.0 1,148.3 1,284.8 1,548.1 1,660.7 1,662.3 1,355.4 1,391.4 1,421.0 1,457.5 1,667.0 17.73
Cash dividends (Note 4) 10.0 20.0 24.0 30.0 34.0 42.0 25.0 17.0 30.0 28.0 37.0 0.39
Ratios:
Gross profi t margin 38.6% 40.9% 41.0% 37.8% 38.4% 38.4% 34.8% 35.1% 37.5% 36.8% 37.1%
Operating income margin 5.4% 8.6% 9.1% 9.9% 8.6% 8.6% 0.9% 2.5% 7.8% 6.5% 7.0%
EBITDA margin 11.1% 13.4% 13.9% 14.9% 13.3% 13.3% 6.2% 7.6% 11.5% 10.1% 10.4%
Return on shareholders’ equity (ROE) 0.2% 10.2% 10.4% 10.7% 10.3% 11.3% (8.7%) 1.2% 8.7% 5.2% 8.8%
Ratio of shareholders’ equity to total assets 44.3% 46.4% 52.2% 61.6% 60.7% 59.7% 55.4% 57.5% 55.6% 59.7% 64.0%
Total return ratio (Note 5) 2475.3% 49.2% 29.1% 47.8% 49.7% 74.7% (29.1%) 106.7% 25.2% 37.7% 27.0%
Operating Income
Omron applies the “single step” presentation of income under U.S. GAAP (that is, the various levels of income are not
presented) in its consolidated statements of income. For easier comparison with other companies, operating income is
presented as gross profi t less selling, general and administrative expenses and research and development expenses.
Discontinued Operations
Figures for FY2006 and prior years have been restated to account for businesses discontinued in FY2007.
Notes: 1. U.S. dollar amounts represent translations of Japanese yen at the approximate exchange rate on March 31, 2013, of ¥94 = $1.
2. EBITDA = Operating income + Depreciation and amortization
3. Free cash fl ow = Net cash provided by operating activities + Net cash used in investing activities
4. Cash dividends per share represent the amounts applicable to the respective year, including dividends to be paid after the end of the year.
5. Total return ratio = (Total dividends paid + Amount of Company’s own shares repurchased) / Net income (loss) attributable to shareholders
Grand Design 2010 (GD2010) Value Generation 2020 (VG2020)
Note: Target fi gures were revised in April 2013.