Oki 2000 Annual Report Download - page 21
Download and view the complete annual report
Please find page 21 of the 2000 Oki annual report below. You can navigate through the pages in the report by either clicking on the pages listed below, or by using the keyword search tool below to find specific information within the annual report.-
 1
1 -
2
-
3
-
4
-
5
-
6
-
7
-
8
-
9
-
10
-
 11
11 -
 12
12 -
 13
13 -
 14
14 -
 15
15 -
 16
16 -
 17
17 -
 18
18 -
 19
19 -
 20
20 -
 21
21 -
 22
22 -
 23
23 -
 24
24 -
 25
25 -
 26
26
 |
 |

19
15. Contingent liabilities
At March 31, 2000, the Company and its consolidated
subsidiaries had the following contingent liabilities:
Thousands of
Millions of yen U.S. dollars
As endorsers of trade notes discounted
and endorsed ....................................... ¥00,680 $006,421
As guarantors of indebtedness of:
Unconsolidated subsidiaries and
affiliates ............................................. 4,286 40,438
Other.................................................... 5,686 53,650
............................................................. ¥10,654 $100,510
16. Amounts per share
Basic net income (loss) per share shown below is based on
the weighted average number of shares of common stock out-
standing during each year. Diluted net income (loss) per share
is based on the weighted average number of shares of common
stock outstanding each year after giving effect to the dilutive
potential of common shares to be issued upon the conversion
of convertible bonds.
Net assets per share are based on the number of shares of
common stock outstanding at each balance sheet date.
Yen
U.S. dollars
2000 1999 1998 2000
Net income (loss) :
Basic ............................ ¥001.87.¥ (77.46.) ¥(13.18.)$0.01.
Diluted.......................... ————
Yen
U.S. dollars
2000 1999 1998 2000
Net assets ....................... ¥232.86.¥230.77.¥321.98.$2.19.
Diluted net income (loss) per share for each year has not
been presented because there would have been no dilutive
effect on any assumed conversion of convertible bonds for the
year ended March 31, 2000 and because net loss was recorded
for the years ended March 31, 1999 and 1998.
17. Subsequent event
On June 29, 2000, the shareholders of the Company approved
the following disposal of accumulated deficit, which has not
been reflected in the accompanying financial statements for the
year ended March 31, 2000:
Thousands of
Millions of yen U.S. dollars
Reversal of special reserve .................... ¥1,590 $15,002
Provision for special reserve .................. (978) (9,233)
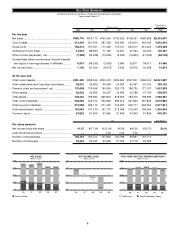
18. Segment information
The Company and its consolidated subsidiaries are engaged
in the manufacture and sale of products in Japan and foreign
countries in one business segment—telecommunications,
information systems and electronic devices.
The geographical segment information of the Company and
its consolidated subsidiaries for the years ended March 31,
2000, 1999 and 1998 is outlined as follows:
Year ended Millions of yen
March 31, 2000
Japan North America Other Total Eliminations Consolidated
Sales to third
parties ........... ¥526,986 ¥073,623 ¥069,166 ¥669,776 ¥ —.¥669,776
Interarea sales
and transfers .. 102,842 377 42,275 145,494 (145,494) —
Total sales ....... 629,829 74,001 111,441 815,271 (145,494) 669,776
Operating
expenses ....... 615,176 75,231 109,835 800,243 (144,270) 655,972
Operating
income (loss) ... ¥((14,652 ¥0((1,230) ¥001,605 ¥015,028 ¥00(1,224) ¥013,804
Total assets ..... ¥759,709 ¥045,627 ¥060,412 ¥865,749 ¥(117,317) ¥748,432
Year ended Millions of yen
March 31, 1999
Japan North America Other Total Eliminations Consolidated
Sales to third
parties ........... ¥520,511 ¥075,854 ¥076,805 ¥673,170 ¥ —.¥673,170
Interarea sales
and transfers .. 102,435 3,306 38,135 143,877 (143,877) —
Total sales ....... 622,946 79,161 114,940 817,048 (143,877) 673,170
Operating
expenses ....... 657,257 83,100 114,440 854,798 (143,330) 711,468
Operating
income (loss) ... ¥)(34,310) ¥0((3,939) ¥000,499 ¥((37,750) ¥000,(547) ¥)(38,297)
Total assets ..... ¥801,817 ¥038,864 ¥056,840 ¥897,523 ¥0(97,628) ¥799,894
Year ended Millions of yen
March 31, 1998
Japan North America Other Total Eliminations Consolidated
Sales to third
parties ........... ¥585,905 ¥093,458 ¥(085,231 ¥764,596 ¥ —.¥764,596
Interarea sales
and transfers .. 102,360 6,433 40,628 149,422 (149,422) —
Total sales ....... 688,265 99,892 125,860 914,018 (149,422) 764,596
Operating
expenses ....... 676,848 106,304 120,379 903,532 (149,029) 754,502
Operating
income (loss) .. ¥011,417 ¥(0(6,412) ¥(005,480 ¥010,486 ¥0000(392) ¥010,093
Total assets ..... ¥823,725 ¥045,958 ¥(059,986 ¥929,671 ¥(0(92,826) ¥836,844
Year ended Thousands of U.S. dollars
March 31, 2000
Japan North America Other Total Eliminations Consolidated
Sales to third
parties ........... $4,971,570 $694,563 $ 652,513 $6,318,647 $(0,000,0—.$6,318,647
Interarea sales
and transfers .. 970,213 3,559 398,820 1,372,593 (1,372,593) —
Total sales ....... 5,941,784 698,122 1,051,333 7,691,240 (1,372,593) 6,318,647
Operating
expenses ....... 5,803,553 709,727 1,036,185 7,549,466 (1,361,046) 6,188,419
Operating
income (loss) ... $0,138,230 $((11,604) $ 15,148 $0,141,774 $0,0(11,546) $0,130,227
Total assets ..... $7,167,070 $430,450 $0,569,930 $8,167,452 $(1,106,770) $7,060,681
Overseas sales, which include export sales of the Company
and its domestic consolidated subsidiaries and sales (other
than exports to Japan) of the foreign consolidated subsidiaries,
totaled ¥163,887 million ($1,546,112 thousand), ¥171,064 mil-
lion and ¥203,191 million, or 24.5%, 25.4% and 26.6% of con-
solidated net sales for the years ended March 31, 2000, 1999
and 1998, respectively.