Occidental Petroleum 2003 Annual Report Download - page 8
Download and view the complete annual report
Please find page 8 of the 2003 Occidental Petroleum annual report below. You can navigate through the pages in the report by either clicking on the pages listed below, or by using the keyword search tool below to find specific information within the annual report.-
 1
1 -
 2
2 -
 3
3 -
 4
4 -
 5
5 -
 6
6 -
 7
7 -
 8
8 -
 9
9 -
 10
10 -
 11
11 -
 12
12 -
 13
13 -
 14
14 -
 15
15 -
 16
16 -
 17
17 -
 18
18 -
 19
19 -
20
-
21
-
22
-
23
-
24
-
25
-
26
-
27
-
28
-
29
-
30
-
31
-
32
-
33
-
34
-
35
-
36
-
37
-
38
-
39
-
40
-
41
-
42
-
43
-
44
-
45
-
46
-
47
-
48
-
49
-
50
-
51
-
52
-
53
-
54
-
55
-
56
-
57
-
58
-
59
-
60
-
61
-
62
-
63
-
64
-
65
-
66
-
67
-
68
-
69
-
70
-
71
-
72
-
73
-
74
-
75
-
76
-
77
-
78
-
79
-
80
-
81
-
82
-
83
-
84
-
85
-
86
-
87
-
88
-
89
-
90
-
91
-
92
-
93
-
94
-
95
-
96
-
97
-
98
-
99
-
100
-
101
-
102
-
103
-
104
-
105
-
106
-
107
-
108
-
109
-
110
-
111
-
112
-
113
-
114
-
115
-
116
-
117
-
118
-
119
-
120
-
121
-
122
-
123
-
124
-
125
-
126
-
127
-
128
-
129
-
130
-
131
-
132
-
133
-
134
-
135
-
136
-
137
-
138
-
139
-
140
-
141
-
142
-
143
-
144
-
145
-
146
-
147
-
148
-
149
-
150
-
151
-
152
-
153
-
154
-
155
-
156
-
157
-
158
 |
 |
plans.
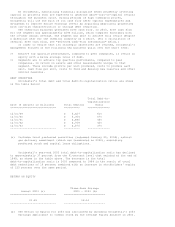
The following is a summary of the shares reserved for issuance as of
December 31, 2003, pursuant to outstanding options, rights or warrants granted
under Occidental's equity compensation plans:
(a) Number of (b) Weighted- (c) Number of securities
securities to be average remaining available
issued upon exercise price for future issuance
exercise of out- of outstanding under equity
standing options, options, compensation plans
warrants and warrants and (excluding securities
rights rights in column (a))
---------------------- ------------------- --------------------------
23,011,923 $26.53 13,101,112 *
* Includes, with respect to the 1995 Incentive Stock Plan, 1,369,796 shares
at maximum target level (684,898 at target level) reserved for issuance
pursuant to outstanding performance stock awards, including 717,876 shares
at maximum target level (358,938 at target level) eligible for
certification in February 2004, and 1,188,596 deferred performance and
restricted stock awards and, with respect to the 2001 Incentive
Compensation Plan, 1,192,018 shares at maximum target level (596,009 at
target level) reserved for issuance pursuant to outstanding performance
stock awards, 1,737,874 shares reserved for issuance pursuant to restricted
stock awards and 3,971 shares reserved for issuance as dividend equivalents
under the 2001 Incentive Compensation Plan. Of the remaining 7,608,857
shares, 7,574,285 shares are available under the 2001 Incentive
Compensation Plan, all of which may be issued or reserved for issuance for
options, rights and warrants as well as performance stock awards,
restricted stock awards, stock bonuses and dividend equivalents and 34,572
shares are available for issuance under the Restricted Stock Plan for
nonemployee directors.
7
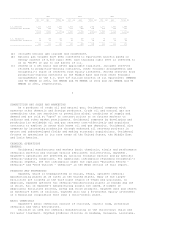
ITEM 6 SELECTED FINANCIAL DATA
FIVE-YEAR SUMMARY OF SELECTED FINANCIAL DATA
Dollar amounts in millions, except per-share amounts
For the years ended December 31, 2003 2002 2001 2000 1999
=============================================================== ======== ======== ======== ======== ========
RESULTS OF OPERATIONS (a)
Net sales $ 9,326 $ 7,338 $ 8,102 $ 8,504 $ 5,594
Income from continuing operations $ 1,595 $ 1,163 $ 1,179 $ 1,557 $ 461
Net income $ 1,527 $ 989 $ 1,154 $ 1,570 $ 448
Earnings applicable to common stock $ 1,527 $ 989 $ 1,154 $ 1,571 $ 442
Basic earnings per common share from
continuing operations $ 4.16 $ 3.09 $ 3.16 $ 4.22 $ 1.28
Basic earnings per common share $ 3.98 $ 2.63 $ 3.10 $ 4.26 $ 1.24
Diluted earnings per common share $ 3.93 $ 2.61 $ 3.09 $ 4.26 $ 1.24
Core earnings (b) $ 1,635 $ 999 $ 1,246 $ 1,349 $ 37
FINANCIAL POSITION (a)
Total assets $ 18,168 $ 16,548 $ 17,850 $ 19,414 $ 14,125
Long-term debt, net $ 3,993 $ 3,997 $ 4,065 $ 5,185 $ 4,368
Trust preferred securities (c) $ 453 $ 455 $ 463 $ 473 $ 486
Common stockholders' equity $ 7,929 $ 6,318 $ 5,634 $ 4,774 $ 3,523
CASH FLOW
Cash provided by operating activities $ 3,074 $ 2,100 $ 2,566 $ 2,348 $ 1,004
Capital expenditures $ (1,601) $ (1,236) $ (1,308) $ (892) $ (557)
Cash (used) provided by all other investing activities, net $ (420) $ (460) $ 657 $ (2,152) $ 2,189
DIVIDENDS PER COMMON SHARE $ 1.04 $ 1.00 $ 1.00 $ 1.00 $ 1.00
BASIC SHARES OUTSTANDING (thousands) 383,943 376,190 372,119 368,750 355,073
--------------------------------------------------------------- -------- -------- -------- -------- --------