Occidental Petroleum 2003 Annual Report Download - page 18
Download and view the complete annual report
Please find page 18 of the 2003 Occidental Petroleum annual report below. You can navigate through the pages in the report by either clicking on the pages listed below, or by using the keyword search tool below to find specific information within the annual report.-
 1
1 -
2
-
3
-
4
-
5
-
6
-
7
-
 8
8 -
 9
9 -
 10
10 -
 11
11 -
 12
12 -
 13
13 -
 14
14 -
 15
15 -
 16
16 -
 17
17 -
 18
18 -
 19
19 -
 20
20 -
 21
21 -
 22
22 -
 23
23 -
 24
24 -
 25
25 -
 26
26 -
 27
27 -
 28
28 -
29
-
30
-
31
-
32
-
33
-
34
-
35
-
36
-
37
-
38
-
39
-
40
-
41
-
42
-
43
-
44
-
45
-
46
-
47
-
48
-
49
-
50
-
51
-
52
-
53
-
54
-
55
-
56
-
57
-
58
-
59
-
60
-
61
-
62
-
63
-
64
-
65
-
66
-
67
-
68
-
69
-
70
-
71
-
72
-
73
-
74
-
75
-
76
-
77
-
78
-
79
-
80
-
81
-
82
-
83
-
84
-
85
-
86
-
87
-
88
-
89
-
90
-
91
-
92
-
93
-
94
-
95
-
96
-
97
-
98
-
99
-
100
-
101
-
102
-
103
-
104
-
105
-
106
-
107
-
108
-
109
-
110
-
111
-
112
-
113
-
114
-
115
-
116
-
117
-
118
-
119
-
120
-
121
-
122
-
123
-
124
-
125
-
126
-
127
-
128
-
129
-
130
-
131
-
132
-
133
-
134
-
135
-
136
-
137
-
138
-
139
-
140
-
141
-
142
-
143
-
144
-
145
-
146
-
147
-
148
-
149
-
150
-
151
-
152
-
153
-
154
-
155
-
156
-
157
-
158
 |
 |
reductions, is expected to result in supply restrictions for vinyl producers.
SEGMENT OPERATIONS
The following discussion of Occidental's two operating segments and
corporate items should be read in conjunction with Note 15 to the Consolidated
Financial Statements.
Segment earnings exclude interest income, interest expense, unallocated
corporate expenses, discontinued operations and the cumulative effect of changes
in accounting principles, but include gains and losses from dispositions of
segment assets and results from the segments' equity investments.
Foreign income and other taxes and certain state taxes are included in
segment earnings based on their operating results. U.S. federal income taxes are
not allocated to segments except for amounts in lieu thereof that represent the
tax effect of operating charges resulting from purchase accounting adjustments,
and the tax effects resulting from major, infrequently occurring transactions,
such as asset dispositions that relate to segment results.
14
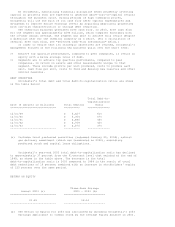
The following table sets forth the sales and earnings of each operating
segment and corporate items:
SEGMENT OPERATIONS
In millions, except per share amounts
For the years ended December 31, 2003 2002 2001
================================= ======== ======== ========
SALES
Oil and Gas $ 6,003 $ 4,634 $ 5,134
Chemical 3,178 2,704 2,968
Other (a) 145 -- --
-------- -------- --------
$ 9,326 $ 7,338 $ 8,102
================================= ======== ======== ========
EARNINGS(LOSS)
Oil and Gas (b) $ 2,664 $ 1,707 $ 2,845
Chemical (b) 210 275 (399)
-------- -------- --------
2,874 1,982 2,446
Unallocated corporate items
Interest expense, net (c)
Debt, net (289) (253) (272)
Trust preferred distributions
and other (44) (47) (56)
Income taxes (d) (662) (364) (359)
Other (d, e) (284) (155) (580)
-------- -------- --------
Income from continuing
operations 1,595 1,163 1,179
Discontinued operations, net -- (79) (1)
Cumulative effect of changes in
accounting principles, net (68) (95) (24)
-------- -------- --------
Net Income $ 1,527 $ 989 $ 1,154
================================= ======== ======== ========
Basic Earnings per
Common Share $ 3.98 $ 2.63 $ 3.10
================================= ======== ======== ========