Occidental Petroleum 2003 Annual Report Download - page 20
Download and view the complete annual report
Please find page 20 of the 2003 Occidental Petroleum annual report below. You can navigate through the pages in the report by either clicking on the pages listed below, or by using the keyword search tool below to find specific information within the annual report.-
 1
1 -
2
-
3
-
4
-
5
-
6
-
7
-
8
-
9
-
 10
10 -
 11
11 -
 12
12 -
 13
13 -
 14
14 -
 15
15 -
 16
16 -
 17
17 -
 18
18 -
 19
19 -
 20
20 -
 21
21 -
 22
22 -
 23
23 -
 24
24 -
 25
25 -
 26
26 -
 27
27 -
 28
28 -
 29
29 -
 30
30 -
31
-
32
-
33
-
34
-
35
-
36
-
37
-
38
-
39
-
40
-
41
-
42
-
43
-
44
-
45
-
46
-
47
-
48
-
49
-
50
-
51
-
52
-
53
-
54
-
55
-
56
-
57
-
58
-
59
-
60
-
61
-
62
-
63
-
64
-
65
-
66
-
67
-
68
-
69
-
70
-
71
-
72
-
73
-
74
-
75
-
76
-
77
-
78
-
79
-
80
-
81
-
82
-
83
-
84
-
85
-
86
-
87
-
88
-
89
-
90
-
91
-
92
-
93
-
94
-
95
-
96
-
97
-
98
-
99
-
100
-
101
-
102
-
103
-
104
-
105
-
106
-
107
-
108
-
109
-
110
-
111
-
112
-
113
-
114
-
115
-
116
-
117
-
118
-
119
-
120
-
121
-
122
-
123
-
124
-
125
-
126
-
127
-
128
-
129
-
130
-
131
-
132
-
133
-
134
-
135
-
136
-
137
-
138
-
139
-
140
-
141
-
142
-
143
-
144
-
145
-
146
-
147
-
148
-
149
-
150
-
151
-
152
-
153
-
154
-
155
-
156
-
157
-
158
 |
 |
Oman 12 13 12
Qatar 45 42 43
Yemen 35 37 33
-------- -------- --------
Total 92 92 88
OTHER EASTERN HEMISPHERE
Crude oil & condensate (MBBL)
Pakistan 9 10 7
Natural Gas (MMCF)
Pakistan 74 63 50
BARRELS OF OIL EQUIVALENT (MBOE)
SUBTOTAL CONSOLIDATED SUBSIDIARIES 520 492 452
Colombia-minority interest (5) (5) (3)
Russia-Occidental net interest 30 27 27
Yemen-Occidental net interest 2 1 --
-------- -------- --------
TOTAL WORLDWIDE PRODUCTION 547 515 476
======== ======== ========
AVERAGE SALES PRICES
CRUDE OIL PRICES ($ per barrel)
U.S. $ 28.74 $ 23.47 $ 21.74
Latin America $ 27.21 $ 23.14 $ 20.10
Middle East (b) $ 27.81 $ 24.13 $ 23.00
Other Eastern Hemisphere $ 26.61 $ 23.02 $ 22.64
Total consolidated subsidiaries $ 28.18 $ 23.56 $ 21.91
Other interests $ 15.95 $ 14.80 $ 15.57
Total worldwide $ 27.25 $ 22.91 $ 21.41
GAS PRICES ($ per thousand cubic feet)
U.S. $ 4.81 $ 2.89 $ 6.40
Other Eastern Hemisphere $ 2.04 $ 2.08 $ 2.29
Total worldwide $ 4.45 $ 2.81 $ 6.09
EXPENSED EXPLORATION (c) $ 139 $ 176 $ 184
CAPITAL EXPENDITURES
Development $ 1,097 $ 897 $ 918
Exploration $ 43 $ 55 $ 86
Acquisitions and other (d, e) $ 97 $ 86 $ 134
---------------------------------------- -------- -------- --------
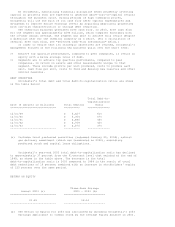
(a) For an explanation of core earnings, see "Significant Items Affecting
Earnings."
(b) These amounts exclude implied taxes.
(c) Includes dry hole write-offs and lease impairments of $80 million in 2003,
$96 million in 2002 and $99 million in 2001.
(d) Includes capitalized portion of injected CO2 of $48 million, $42 million
and $48 million in 2003, 2002 and 2001, respectively.
(e) Includes mineral acquisitions but excludes significant acquisitions
individually discussed in this report.
15
Core earnings in 2003 were $2.7 billion compared with $1.7 billion in 2002.
The increase in core earnings primarily reflects the impact of higher crude oil
and natural gas prices and higher crude oil production volumes, partially offset
by lower natural gas production volumes, higher depreciation, depletion and
amortization (DD&A) rates and increased costs.
CHEMICAL