Occidental Petroleum 2003 Annual Report Download - page 19
Download and view the complete annual report
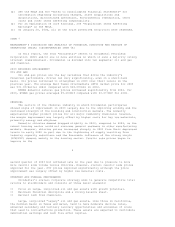
Please find page 19 of the 2003 Occidental Petroleum annual report below. You can navigate through the pages in the report by either clicking on the pages listed below, or by using the keyword search tool below to find specific information within the annual report.(a) The 2003 amount represents revenue from a co-generation plant in Taft,
Louisiana.
(b) Includes U.S. federal tax charge of $6 million related to oil and gas in
2003. Segment earnings in 2002 were affected by $402 million of net credits
allocated, comprising $1 million of charges and $403 million of credits in
oil and gas and chemical, respectively. The chemical amount includes a $392
million credit for the sale of the Equistar investment, which resulted in a
net gain of $164 million. Segment earnings in 2001 were affected by $14
million of net charges allocated, comprising $56 million of charges and $42
million of credits in oil and gas and chemical, respectively. The oil and
gas amount includes a charge for the sale of the Indonesian Tangguh LNG
project. The chemical amount includes credits for the sale of certain
chemical operations.
(c) The 2003 amount includes a $61 million interest charge to repay a $450
million senior note that had 10 years of remaining life, but subject to
remarketing on April 1, 2003. The 2002 and 2001 amounts are net of $21
million and $102 million, respectively, of interest income on notes
receivable from Altura partners.
(d) The 2001 tax amount excludes the income tax benefit of $188 million
attributed to the sale of the entity that owns a Texas intrastate pipeline
system. The tax benefit is included in Other.
(e) The 2003 amount includes $58 million of corporate equity-method investment
losses and $63 million of environmental remediation expense. The 2002
amount includes $22 million of preferred distributions to the Altura
partners, $23 million of environmental remediation expenses and $25 million
of corporate equity-method investment losses. The 2001 amount includes the
after-tax loss of $272 million related to the sale of the entity that owns
a Texas intrastate pipeline system, a $109 million charge for environmental
remediation expenses and $104 million of preferred distributions to the
Altura partners.
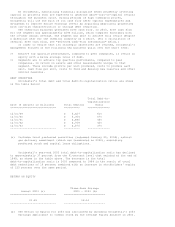
OIL AND GAS
In millions, except as indicated 2003 2002 2001
======================================== ======== ======== ========
SEGMENT SALES $ 6,003 $ 4,634 $ 5,134
SEGMENT EARNINGS $ 2,664 $ 1,707 $ 2,845
CORE EARNINGS (a) $ 2,664 $ 1,707 $ 2,446
NET PRODUCTION PER DAY
UNITED STATES
Crude oil and liquids (MBBL)
California 81 86 76
Permian 150 142 137
Horn Mountain 21 1 --
Hugoton 4 3 --
-------- -------- --------
Total 256 232 213
Natural Gas (MMCF)
California 252 286 303
Hugoton 138 148 159
Permian 129 130 148
Horn Mountain 13 -- --
-------- -------- --------
Total 532 564 610
LATIN AMERICA
Crude oil & condensate (MBBL)
Colombia 37 40 21
Ecuador 25 13 13
-------- -------- --------
Total 62 53 34
MIDDLE EAST
Crude oil & condensate (MBBL)


