Occidental Petroleum 2003 Annual Report Download - page 4
Download and view the complete annual report
Please find page 4 of the 2003 Occidental Petroleum annual report below. You can navigate through the pages in the report by either clicking on the pages listed below, or by using the keyword search tool below to find specific information within the annual report.-
 1
1 -
 2
2 -
 3
3 -
 4
4 -
 5
5 -
 6
6 -
 7
7 -
 8
8 -
 9
9 -
 10
10 -
 11
11 -
 12
12 -
 13
13 -
 14
14 -
 15
15 -
16
-
17
-
18
-
19
-
20
-
21
-
22
-
23
-
24
-
25
-
26
-
27
-
28
-
29
-
30
-
31
-
32
-
33
-
34
-
35
-
36
-
37
-
38
-
39
-
40
-
41
-
42
-
43
-
44
-
45
-
46
-
47
-
48
-
49
-
50
-
51
-
52
-
53
-
54
-
55
-
56
-
57
-
58
-
59
-
60
-
61
-
62
-
63
-
64
-
65
-
66
-
67
-
68
-
69
-
70
-
71
-
72
-
73
-
74
-
75
-
76
-
77
-
78
-
79
-
80
-
81
-
82
-
83
-
84
-
85
-
86
-
87
-
88
-
89
-
90
-
91
-
92
-
93
-
94
-
95
-
96
-
97
-
98
-
99
-
100
-
101
-
102
-
103
-
104
-
105
-
106
-
107
-
108
-
109
-
110
-
111
-
112
-
113
-
114
-
115
-
116
-
117
-
118
-
119
-
120
-
121
-
122
-
123
-
124
-
125
-
126
-
127
-
128
-
129
-
130
-
131
-
132
-
133
-
134
-
135
-
136
-
137
-
138
-
139
-
140
-
141
-
142
-
143
-
144
-
145
-
146
-
147
-
148
-
149
-
150
-
151
-
152
-
153
-
154
-
155
-
156
-
157
-
158
 |
 |
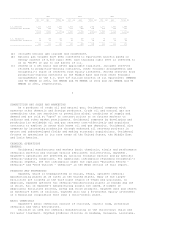
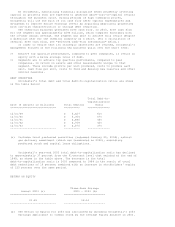
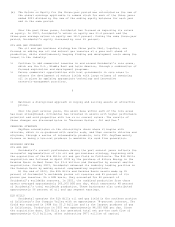
2003 2002 2001
======================== ============================== =============================== ===============================
OIL (a) GAS TOTAL (b) Oil (a) Gas Total (b) Oil (a) Gas Total (b)
------- ------- ------- ------- ------- ------- ------- ------- -------
U.S. Reserves 1,500 1,826 1,805 1,452 1,821 1,755 1,371 1,962 1,698
International Reserves 538 768 666 518 228 556 526 106 543
------- ------- ------- ------- ------- ------- ------- ------- -------
2,038 2,594 2,471(c) 1,970 2,049 2,311(c) 1,897 2,068 2,241(c)
======= ======= ======= ======= ======= ======= ======= ======= =======
U.S. Production 93 194 125 85 206 119 78 223 115
International Production 70 27 75 65 23 69 55 18 59
------- ------- ------- ------- ------- ------- ------- ------- -------
163 221 200 150 229 188 133 241 174
======================== ======= ======= ======= ======= ======= ======= ======= ======= =======
(a) Includes natural gas liquids and condensate.
(b) Natural gas volumes have been converted to equivalent barrels based on
energy content of 6,000 cubic feet (one thousand cubic feet is referred to
as an "Mcf") of gas to one barrel of oil.
(c) Stated on a net basis and after applicable royalties. Includes reserves
related to production-sharing contracts, other economic arrangements and
Occidental's share of reserves from equity investees. Proved reserves from
production-sharing contracts in the Middle East and from other economic
arrangements in the U.S. were 437 million barrels of oil equivalent (MMBOE)
and 90 MMBOE in 2003, 324 MMBOE and 94 MMBOE in 2002 and 321 MMBOE and 99
MMBOE in 2001, respectively.
3
COMPETITION AND SALES AND MARKETING
As a producer of crude oil and natural gas, Occidental competes with
numerous other domestic and foreign producers. Crude oil and natural gas are
commodities that are sensitive to prevailing global conditions of supply and
demand and are sold at "spot" or contract prices or on futures markets to
refiners and other market participants. Occidental competes by developing and
producing its worldwide oil and gas reserves cost-effectively and acquiring
contracts to explore in areas with known oil and gas deposits. Occidental also
competes by increasing production through enhanced oil recovery projects in
mature and underdeveloped fields and making strategic acquisitions. Occidental
focuses on operations in its core areas of the United States, the Middle East
and Latin America.
CHEMICAL OPERATIONS
GENERAL
Occidental manufactures and markets basic chemicals, vinyls and performance
chemicals directly and through various affiliates (collectively, OxyChem).
OxyChem's operations are affected by cyclical economic factors and by specific
chemical-industry conditions. For additional information regarding Occidental's
chemical segment, see the information under the captions "Business Review -
Chemical" and "2004 Outlook - Chemical" in the MD&A section of this report.
PRODUCTS AND PROPERTIES
OxyChem, which is headquartered in Dallas, Texas, operates chemical
manufacturing plants at 26 sites in the United States. Many of the larger
facilities are located in the Gulf Coast region of Texas and Louisiana. In
addition, OxyChem operates two chemical-manufacturing plants in Canada and one
in Chile. All of OxyChem's manufacturing plants are owned. A number of
additional facilities process, blend and store products. OxyChem owns and leases
an extensive fleet of railcars. OxyChem also has a 50-percent equity investment
in a Brazilian corporation that owns a chlor-alkali plant.
BASIC CHEMICALS
OxyChem's basic chemicals consist of chlorine, caustic soda, potassium
chemicals and their derivatives.
Chlorine is used for chemical manufacturing in the chlorovinyl chain and
for water treatment. OxyChem produces chlorine in Alabama, Delaware, Louisiana,