Occidental Petroleum 2003 Annual Report Download - page 11
Download and view the complete annual report
Please find page 11 of the 2003 Occidental Petroleum annual report below. You can navigate through the pages in the report by either clicking on the pages listed below, or by using the keyword search tool below to find specific information within the annual report.-
 1
1 -
 2
2 -
 3
3 -
 4
4 -
 5
5 -
 6
6 -
 7
7 -
 8
8 -
 9
9 -
 10
10 -
 11
11 -
 12
12 -
 13
13 -
 14
14 -
 15
15 -
 16
16 -
 17
17 -
 18
18 -
 19
19 -
 20
20 -
 21
21 -
 22
22 -
23
-
24
-
25
-
26
-
27
-
28
-
29
-
30
-
31
-
32
-
33
-
34
-
35
-
36
-
37
-
38
-
39
-
40
-
41
-
42
-
43
-
44
-
45
-
46
-
47
-
48
-
49
-
50
-
51
-
52
-
53
-
54
-
55
-
56
-
57
-
58
-
59
-
60
-
61
-
62
-
63
-
64
-
65
-
66
-
67
-
68
-
69
-
70
-
71
-
72
-
73
-
74
-
75
-
76
-
77
-
78
-
79
-
80
-
81
-
82
-
83
-
84
-
85
-
86
-
87
-
88
-
89
-
90
-
91
-
92
-
93
-
94
-
95
-
96
-
97
-
98
-
99
-
100
-
101
-
102
-
103
-
104
-
105
-
106
-
107
-
108
-
109
-
110
-
111
-
112
-
113
-
114
-
115
-
116
-
117
-
118
-
119
-
120
-
121
-
122
-
123
-
124
-
125
-
126
-
127
-
128
-
129
-
130
-
131
-
132
-
133
-
134
-
135
-
136
-
137
-
138
-
139
-
140
-
141
-
142
-
143
-
144
-
145
-
146
-
147
-
148
-
149
-
150
-
151
-
152
-
153
-
154
-
155
-
156
-
157
-
158
 |
 |
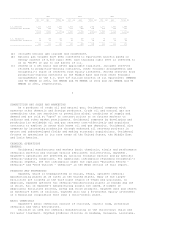
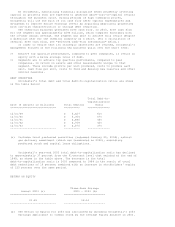
earnings applicable to common stock by the average equity balance in 2003.
(b) The Return on Equity for the three-year period was calculated as the sum of
the annual earnings applicable to common stock for each of the three years
ended 2003 divided by the sum of the ending equity balances for each year
end in the same period.
Over the past three years, Occidental has focused on improving its return
on equity. In 2003, Occidental's return on equity was 21.4 percent and the
three-year average return on equity was 18.5 percent. During the same three-year
period, Occidental's equity increased by over 41 percent.
OIL AND GAS STRATEGY
The oil and gas business strategy has three parts that, together, are
focused on adding new oil and natural gas reserves at a pace well ahead of
production, while simultaneously keeping finding and development costs among the
lowest in the industry:
>> Continue to add commercial reserves in and around Occidental's core areas,
which are the U.S., Middle East and Latin America, through a combination of
focused exploration and development programs.
>> Pursue commercial opportunities with host governments in core areas to
enhance the development of mature fields with large volumes of remaining
oil in place by applying appropriate technology and innovative
reservoir-management practices.
9
>> Maintain a disciplined approach in buying and selling assets at attractive
prices.
Over the past several years, the asset base within each of the core areas
has been strengthened. Occidental has invested in assets with higher performance
potential and sold properties with low or no current return. The results of
these changes are discussed below in "Business Review - Oil and Gas."
CHEMICAL STRATEGY
OxyChem concentrates on the chlorovinyls chain where it begins with
chlorine, which is co-produced with caustic soda, and then converts chlorine and
ethylene, through a series of intermediate products, into PVC. OxyChem mainly
focuses on being a low-cost producer to maximize its cash flow generation.
BUSINESS REVIEW
OIL AND GAS
Occidental's overall performance during the past several years reflects the
successful implementation of its oil and gas business strategy, beginning with
the acquisition of the Elk Hills oil and gas field in California. The Elk Hills
acquisition was followed in April 2000 by the purchase of Altura Energy in the
Permian Basin in West Texas for $3.6 billion and thereafter by several smaller
acquisitions. During 2003, Occidental enhanced its industry leading position in
the Permian Basin by making several complementary acquisitions.
At the end of 2003, the Elk Hills and Permian Basin assets made up 65
percent of Occidental's worldwide proven oil reserves and 45 percent of its
proven gas reserves. On a BOE basis, they accounted for 62 percent of
Occidental's worldwide reserves. In 2003, the combined production from these
assets averaged approximately 265,000 BOE per day, which represents 48 percent
of Occidental's total worldwide production. These businesses also contributed
approximately 56 percent of oil and gas segment earnings.
ELK HILLS
Occidental operates the Elk Hills oil and gas field in the southern portion
of California's San Joaquin Valley with an approximate 78-percent interest. The
field was acquired in 1998 for $3.5 billion and is the largest producer of gas
in California. Production in 2003 was approximately 94,000 BOE per day. Since
the acquisition date, Elk Hills has generated total net pre-tax cash flow of
approximately $3.5 billion, after subtracting $871 million of capital