Occidental Petroleum 2002 Annual Report Download - page 9
Download and view the complete annual report
Please find page 9 of the 2002 Occidental Petroleum annual report below. You can navigate through the pages in the report by either clicking on the pages listed below, or by using the keyword search tool below to find specific information within the annual report.-
 1
1 -
 2
2 -
 3
3 -
 4
4 -
 5
5 -
 6
6 -
 7
7 -
 8
8 -
 9
9 -
 10
10 -
 11
11 -
 12
12 -
 13
13 -
 14
14 -
 15
15 -
 16
16 -
 17
17 -
 18
18 -
 19
19 -
 20
20 -
21
-
22
-
23
-
24
-
25
-
26
-
27
-
28
-
29
-
30
-
31
-
32
-
33
-
34
-
35
-
36
-
37
-
38
-
39
-
40
-
41
-
42
-
43
-
44
-
45
-
46
-
47
-
48
-
49
-
50
-
51
-
52
-
53
-
54
-
55
-
56
-
57
-
58
-
59
-
60
-
61
-
62
-
63
-
64
-
65
-
66
-
67
-
68
-
69
-
70
-
71
-
72
-
73
-
74
-
75
-
76
-
77
-
78
-
79
-
80
-
81
-
82
-
83
-
84
-
85
-
86
-
87
-
88
-
89
-
90
-
91
-
92
-
93
-
94
-
95
-
96
-
97
-
98
-
99
-
100
-
101
-
102
-
103
-
104
-
105
-
106
-
107
-
108
-
109
-
110
-
111
-
112
-
113
-
114
-
115
-
116
-
117
-
118
-
119
-
120
-
121
-
122
-
123
-
124
-
125
-
126
-
127
-
128
-
129
-
130
-
131
-
132
-
133
-
134
-
135
-
136
-
137
-
138
-
139
-
140
-
141
-
142
-
143
-
144
-
145
-
146
-
147
-
148
-
149
 |
 |
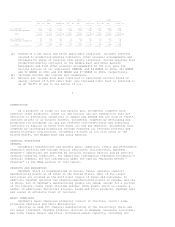
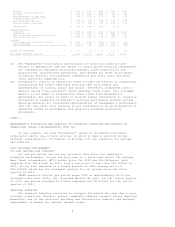
Net sales $ 7,338 $ 8,102 $ 8,504 $ 5,594 $ 5,015
Income from continuing operations $ 1,163 $ 1,179 $ 1,557 $ 461 $ 327
Net income $ 989 $ 1,154 $ 1,570 $ 448 $ 363
Earnings applicable to common stock $ 989 $ 1,154 $ 1,571 $ 442 $ 346
Basic earnings per common share from
continuing operations $ 3.09 $ 3.16 $ 4.22 $ 1.28 $ 0.89
Basic earnings per common share $ 2.63 $ 3.10 $ 4.26 $ 1.24 $ 0.99
Diluted earnings per common share $ 2.61 $ 3.09 $ 4.26 $ 1.24 $ 0.99
Core earnings(b) $ 999 $ 1,246 $ 1,349 $ 37 $ 9
FINANCIAL POSITION(a)
Total assets $ 16,548 $ 17,850 $ 19,414 $ 14,125 $ 15,252
Long-term debt, net $ 3,997 $ 4,065 $ 5,185 $ 4,368 $ 5,367
Trust Preferred Securities and preferred stock $ 455 $ 463 $ 473 $ 486 $ 243
Common stockholders' equity $ 6,318 $ 5,634 $ 4,774 $ 3,523 $ 3,120
CASH FLOW
Cash provided (used) by operating activities $ 2,100 $ 2,566 $ 2,348 $ 1,004 $ (2)
Capital expenditures $ (1,236) $ (1,308) $ (892) $ (557) $ (982)
Cash (used) provided by all other investing activities, net $ (460) $ 657 $ (2,152) $ 2,189 $ (153)
DIVIDENDS PER COMMON SHARE $ 1.00 $ 1.00 $ 1.00 $ 1.00 $ 1.00
BASIC SHARES OUTSTANDING (thousands) 376,190 372,119 368,750 355,073 349,931
-------------------------------------------------------------- ---------- ---------- ---------- ---------- ----------
(a) See "Management's Discussion and Analysis of Financial Condition and
Results of Operations" and the "Notes to Consolidated Financial Statements"
for information regarding accounting changes, asset acquisitions and
dispositions, discontinued operations, and charges for asset write-downs,
litigation matters, environmental remediation and other costs and other
items affecting comparability.
(b) Occidental's results of operations often include the effects of significant
transactions and events affecting earnings that vary widely and
unpredictably in timing, nature and amount. Therefore, management uses a
measure called "core earnings", which excludes those items. This non-GAAP
measure is not meant to disassociate those items from management's
performance, but rather is meant to provide useful information to investors
interested in comparing Occidental's earnings performance between periods.
Reported earnings are considered representative of management's performance
over the long term. Core earnings is not considered to be an alternative to
operating income in accordance with generally accepted accounting
principles.
ITEM 7
MANAGEMENT'S DISCUSSION AND ANALYSIS OF FINANCIAL CONDITION AND RESULTS OF
OPERATIONS (MD&A) (INCORPORATING ITEM 7A)
In this report, the term "Occidental" refers to Occidental Petroleum
Corporation and/or one or more entities in which it owns a majority voting
interest (subsidiaries). Occidental is divided into two segments: oil and gas
and chemical.
2002 BUSINESS ENVIRONMENT
OIL AND NATURAL GAS INDUSTRY
Oil and gas prices are the key variables that drive the industry's
financial performance. Prices can vary even on a short-term basis. The average
West Texas Intermediate (WTI) market price for 2002 was $26.08/barrel (bbl)
compared with $25.97/bbl in 2001. From a low point of less than $20.00/bbl in
2001, prices have improved to a fourth quarter of 2002 average price of
$28.15/bbl, which was the strongest quarter for oil prices since the first
quarter of 2001.
NYMEX domestic natural gas prices began 2002 at approximately $2.50 per
thousand cubic feet (Mcf), but increased during the year. For the fourth quarter
of 2002, gas prices averaged $3.57/Mcf compared with $2.55/Mcf for the fourth
quarter of 2001.
CHEMICAL INDUSTRY
The chemical industry continued to struggle throughout the year due to poor
economic conditions. However, several commodity chemical product prices improved
moderately due to the resilient building and construction industry and marginal
improvement in demand for general durable goods.
8