Occidental Petroleum 2001 Annual Report Download - page 21
Download and view the complete annual report
Please find page 21 of the 2001 Occidental Petroleum annual report below. You can navigate through the pages in the report by either clicking on the pages listed below, or by using the keyword search tool below to find specific information within the annual report.-
 1
1 -
2
-
3
-
4
-
5
-
6
-
7
-
8
-
9
-
10
-
 11
11 -
 12
12 -
 13
13 -
 14
14 -
 15
15 -
 16
16 -
 17
17 -
 18
18 -
 19
19 -
 20
20 -
 21
21 -
 22
22 -
 23
23 -
 24
24 -
 25
25 -
 26
26 -
 27
27 -
 28
28 -
 29
29 -
 30
30 -
 31
31 -
32
-
33
-
34
-
35
-
36
-
37
-
38
-
39
-
40
-
41
-
42
-
43
-
44
-
45
-
46
-
47
-
48
-
49
-
50
-
51
-
52
-
53
-
54
-
55
-
56
-
57
-
58
-
59
-
60
-
61
-
62
-
63
-
64
-
65
-
66
-
67
-
68
-
69
-
70
-
71
-
72
-
73
-
74
-
75
-
76
-
77
-
78
-
79
-
80
-
81
-
82
-
83
-
84
-
85
-
86
-
87
-
88
-
89
-
90
-
91
-
92
-
93
-
94
-
95
-
96
-
97
-
98
-
99
-
100
-
101
-
102
-
103
-
104
-
105
-
106
-
107
-
108
-
109
-
110
-
111
-
112
-
113
-
114
-
115
-
116
 |
 |
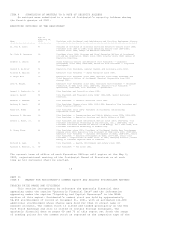
SEGMENT OPERATIONS
In millions
For the years ended December 31, 2001 2000 1999
================================ ======== ======== ========
SALES
Oil and Gas $ 10,893 $ 9,779 $ 4,599
Chemical 3,092 3,795 3,221
-------- -------- --------
$ 13,985 $ 13,574 $ 7,820
================================ ======== ======== ========
EARNINGS(LOSS)
Oil and Gas $ 2,845 $ 2,417 $ 1,267
Chemical (394) 169 (37)
-------- -------- --------
2,451 2,586 1,230
Unallocated corporate items
Interest expense, net(a) (263) (380) (468)
Income taxes(c) (366) (861) (68)
Trust preferred distributions (56) (67) (62)
and other
Other (b) (580) 291 (64)
-------- -------- --------
Income before extraordinary
items and effect of changes in
accounting principles 1,186 1,569 568
Extraordinary gain(loss), net (8) 1 (107)
Cumulative effect of changes in
accounting principles, net (24) -- (13)
-------- -------- --------
Net Income $ 1,154 $ 1,570 $ 448
================================ ======== ======== ========
(a) The 2001 and 2000 amounts are net of $102 million and $106 million,
respectively, of interest income on notes receivable from Altura partners.
(b) The 2001 amount includes the after-tax loss of $272 million related to the
sale of the entity that owns pipelines in Texas that were leased to a
former subsidiary, a $109 million charge for environmental remediation
expenses and $104 million of preferred distributions to the Altura
partners. The 2000 amount includes the pre-tax gain on the sale of the
CanadianOxy investment of $493 million, partially offset by preferred
distributions to the Altura partners of $107 million. The preferred
distributions are essentially offset by the interest income discussed in
(a) above.
(c) The 2001 amount excludes the income tax benefit of $188 million attributed
to the sale of the entity that owns pipelines in Texas.
<
OIL AND GAS
In millions, except as indicated 2001 2000 1999
===================================== ======== ======== ========
SEGMENT SALES $ 10,893 $ 9,779 $ 4,599
SEGMENT EARNINGS $ 2,845 $ 2,417 $ 1,267
EARNINGS BEFORE SPECIAL ITEMS(a) $ 2,439 $ 2,404 $ 841
NET PRODUCTION PER DAY
UNITED STATES
Crude oil and liquids (MBBL)
California 76 70 52
Permian 137 101 13
U.S. Other -- 1 8
-------- -------- --------
Total 213 172 73
Natural Gas (MMCF)