Occidental Petroleum 2001 Annual Report Download - page 13
Download and view the complete annual report
Please find page 13 of the 2001 Occidental Petroleum annual report below. You can navigate through the pages in the report by either clicking on the pages listed below, or by using the keyword search tool below to find specific information within the annual report.-
 1
1 -
2
-
 3
3 -
 4
4 -
 5
5 -
 6
6 -
 7
7 -
 8
8 -
 9
9 -
 10
10 -
 11
11 -
 12
12 -
 13
13 -
 14
14 -
 15
15 -
 16
16 -
 17
17 -
 18
18 -
 19
19 -
 20
20 -
 21
21 -
 22
22 -
 23
23 -
24
-
25
-
26
-
27
-
28
-
29
-
30
-
31
-
32
-
33
-
34
-
35
-
36
-
37
-
38
-
39
-
40
-
41
-
42
-
43
-
44
-
45
-
46
-
47
-
48
-
49
-
50
-
51
-
52
-
53
-
54
-
55
-
56
-
57
-
58
-
59
-
60
-
61
-
62
-
63
-
64
-
65
-
66
-
67
-
68
-
69
-
70
-
71
-
72
-
73
-
74
-
75
-
76
-
77
-
78
-
79
-
80
-
81
-
82
-
83
-
84
-
85
-
86
-
87
-
88
-
89
-
90
-
91
-
92
-
93
-
94
-
95
-
96
-
97
-
98
-
99
-
100
-
101
-
102
-
103
-
104
-
105
-
106
-
107
-
108
-
109
-
110
-
111
-
112
-
113
-
114
-
115
-
116
 |
 |
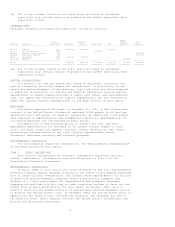
(a) See "Management's Discussion and Analysis of Financial Condition and
Results of Operations" and the "Notes to Consolidated Financial Statements"
for information regarding accounting changes, asset acquisitions and
dispositions, discontinued operations, and charges for asset write-downs,
litigation matters, environmental remediation and other costs and other
special items affecting comparability.
(b) Earnings before special items reflects adjustments to net income(loss) to
exclude the after-tax effect of certain infrequent transactions that may
affect comparability between years. See the "Special Items" table for the
specific nature of these items in 2001, 2000 and 1999. Management believes
the presentation of earnings before special items provides a meaningful
comparison of earnings between years to the readers of the consolidated
financial statements. Earnings before special items is not considered to be
an alternative to operating income in accordance with generally accepted
accounting principles.
ITEM 7
MANAGEMENT'S DISCUSSION AND ANALYSIS OF FINANCIAL CONDITION AND RESULTS OF
OPERATIONS (INCORPORATING ITEM 7A)
2001 BUSINESS ENVIRONMENT
In this report, the term "Occidental" refers to Occidental Petroleum
Corporation and/or one or more entities in which it owns a majority voting
interest (subsidiaries). Occidental is divided into two major operating
businesses.
OIL AND NATURAL GAS INDUSTRY
The market price of West Texas Intermediate (WTI) declined considerably
during 2001, falling from around $30/bbl in January to less than $20/bbl in
December. The fourth quarter was the weakest for oil prices since the third
quarter of 1999. Overall, the crude oil market continued to indicate both
long-term and short-term price uncertainty.
NYMEX domestic natural gas prices were subject to greater volatility in
2001. Natural gas prices, which were over $5/thousand cubic feet (Mcf) in the
fourth quarter of 2000, rose to $7/Mcf in the first quarter of 2001 and then
declined significantly to less than $3/Mcf by year-end. Increased supply from
heavy investment in drilling by the industry in 2000 and 2001, higher
inventories and decreased demand combined to lower gas prices back to the level
last seen in the first quarter of 2000.
The number of U.S. onshore rigs in use climbed from under 500 in mid-1999
to over 1,100 in mid-2001, but the decline in oil and gas prices resulted in
fewer than 800 rigs in use by the end of the year.
CHEMICAL INDUSTRY
The chemical industry experienced a significant decrease in demand as the
decade-long U.S. economic expansion gave way to a recession in March 2001
following a slowdown that began midway through 2000. Due to a pessimistic
outlook and no near-term signs of economic recovery, customers and distributors
continued with inventory reduction and limited purchases. Most Asian, European
and South American countries also experienced an economic downturn similar to
North American trends. Record-high energy prices and feedstock costs began to
drop in the second quarter, but poor product demand for the year resulted in
overall weaker prices and profit margins.
12
Domestic chlorine demand decreased significantly in 2001, compared with
2000, due to poor demand for chlorine derivatives including vinyls, polyurethane
chemicals, epichlorohydrin and others, which are primarily used in durable goods
and consumer products. The poor chlorine demand resulted in chlorine prices
declining throughout the year. Caustic soda prices peaked in the first half of
the year due to major cutbacks in chlorine production. Demand was stable in the
first half of the year but began to soften in the third quarter. Polyvinyl
chloride (PVC) prices, but not margins, improved for a short time reflecting
higher energy and feedstock prices during the first few months before reaching a
peak in April, but weakened throughout the remainder of the year due to poor
demand and increased industry capacity.