Nissan 2014 Annual Report Download - page 7
Download and view the complete annual report
Please find page 7 of the 2014 Nissan annual report below. You can navigate through the pages in the report by either clicking on the pages listed below, or by using the keyword search tool below to find specific information within the annual report.-
 1
1 -
 2
2 -
 3
3 -
 4
4 -
 5
5 -
 6
6 -
 7
7 -
 8
8 -
 9
9 -
 10
10 -
 11
11 -
 12
12 -
 13
13 -
 14
14 -
 15
15 -
 16
16 -
 17
17 -
 18
18 -
19
-
20
-
21
-
22
-
23
-
24
-
25
-
26
-
27
-
28
-
29
-
30
-
31
-
32
-
33
-
34
 |
 |

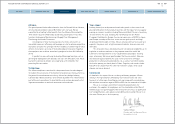
* Based on continuation of proportionate consolidation of China JV
200.0
100.0
300.0
400.0
0
2009 2010 2011 2012 2013
42.4
319.2
341.4 342.4
389.0 389.0
0
100.0
200.0
300.0
400.0
500.0
2009 2010 2011 2012 2013
375.5
459.3
379.5
208.1 199.7
248.6
–200.0
0
800.0
600.0
400.0
1,000.0
1,200.0
200.0
2009 2010 2011 2012 2013
–29.7
293.3
619.8
915.9
1,133.7
1,015.9
1,000
2,000
3,000
4,000
5,000
6,000
0
2.0
4.0
6.0
8.0
10.0
12.0
0
2009 2010 2011 2012 2013
3,515
5.5
4,185
5.8
4,845
6.4
4,914
6.2
5,188
6.2
2,000.0
4,000.0
6,000.0
8,000.0
10,000.0
12,000.0
0
2009 2010 2011 2012 2013
7,517.3
8,773.1 9,409.0 9,629.6
11,434.8
10,482.5
0
700.0
100.0
200.0
300.0
400.0
500.0
600.0
2009 2010 2011 2012 2013
311.6
537.5 545.8 523.5
605.7
498.4
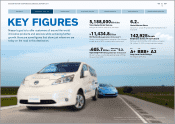
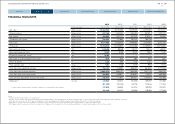
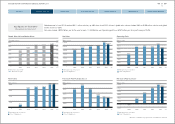
Global demand in fiscal 2013 reached 83.11 million vehicles, up 4.8% from fiscal 2012. Nissan's global sales volume climbed 5.6% to 5.188 million vehicles and global
market share was 6.2%.
Net sales climbed 1,805.2 billion yen for the year to reach 11,434.8 billion yen. Operating profit was 605.7 billion yen, for a profit margin of 5.3%.
Key figures for fiscal 2013
(Management pro forma basis*)
Global sales volume (left)
Market share (right)
Management pro forma basis*
China JV Equity basis
Management pro forma basis*
China JV Equity basis
Management pro forma basis*
China JV Equity basis
Management pro forma basis*
China JV Equity basis
Management pro forma basis*
China JV Equity basis
Global Sales Volume/Market Share
Net Income
N e t S a l e s
F r e e C a s h F l o w(Auto business)
Operating Profit
N e t C a s h(A u t o b u s i n e s s )
(Thousands of units) (%)
(Billions of yen)
(Billions of yen)
(Billions of yen)
(Billions of yen)
(Billions of yen)
(FY)
(FY)
(FY) (FY)
(FY) (FY)
06
NISSAN MOTOR CORPORATION ANNUAL REPORT 2014
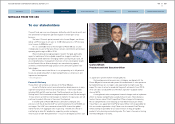
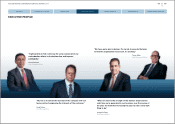
CORPORATE FACE TIME
CONTENTS
PERFORMANCE
NISSAN POWER 88
CORPORATE GOVERNANCE
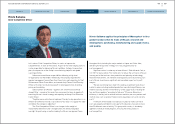
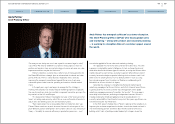
CEO MESSAGE
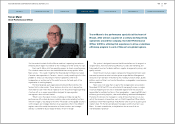
EXECUTIVE PROFILE