Nissan 2014 Annual Report Download - page 27
Download and view the complete annual report
Please find page 27 of the 2014 Nissan annual report below. You can navigate through the pages in the report by either clicking on the pages listed below, or by using the keyword search tool below to find specific information within the annual report.-
 1
1 -
2
-
3
-
4
-
5
-
6
-
7
-
8
-
9
-
10
-
11
-
12
-
13
-
14
-
15
-
16
-
 17
17 -
 18
18 -
 19
19 -
 20
20 -
 21
21 -
 22
22 -
 23
23 -
 24
24 -
 25
25 -
 26
26 -
 27
27 -
 28
28 -
 29
29 -
 30
30 -
 31
31 -
 32
32 -
 33
33 -
 34
34
 |
 |
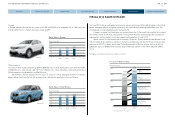
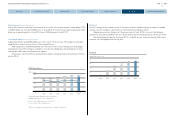
Balance sheet (China JV Equity basis)
Total assets have increased by 18.2% to 14,703.4 billion yen compared to March 31, 2013.
Current assets have increased by 19.3% to 8,609.3 billion yen compared to March 31, 2013.
This was mainly attributable to an increase in Sales finance receivables by 871.6 billion yen.
Fixed assets have increased by 16.6% to 6,094.1 billion yen compared to March 31, 2013.
This was mainly attributable to an increase in Machinery, equipment and vehicles, net by 393.8
billion yen and an increase in investment securities by 212.7 billion yen.
Current liabilities have increased by 22.0% to 5,187.2 billion yen compared to March 31, 2013.
This was mainly due to increase in note payable and account payable by 343.3 billion yen and
Short-term borrowings by 186.8 billion yen.
Long-term liabilities have increased by 16.7% to 4,844.6 billion yen compared to March 31,
2013. This was mainly due to increase in Long-term borrowings by 330.2 billion yen and bonds by
247.1 billion yen.
Net assets have increased by 15.7% to 4,671.5 billion yen compared to 4,036.0 billion yen as
of March 31, 2013. This was mainly due to Net income of 389.0 billion yen and a decrease in
Translation adjustments by 310.9 billion yen.
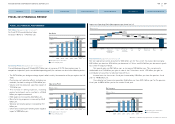
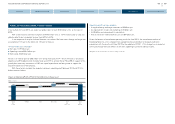
Free cash flow and net cash (auto business) (Management pro forma basis*)
For fiscal 2013, Nissan achieved a positive free cash flow of 208.1 billion yen. At the end of fiscal
2013, our net automotive cash improved from the previous fiscal year to 1,133.7 billion yen.
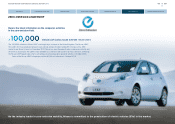
We continue to maintain a close focus on our inventory of new vehicles. Inventory stood at
970,000 units at the end of fiscal 2013. The company continues to manage inventory carefully, in
order to limit its impact on free cash flow.
Aa3 AA–
A1 A+
A2 A
A3 A–
Baa1 BBB+
Baa2 BBB
Baa3 BBB–
Ba1 BB+
FINANCIAL POSITION
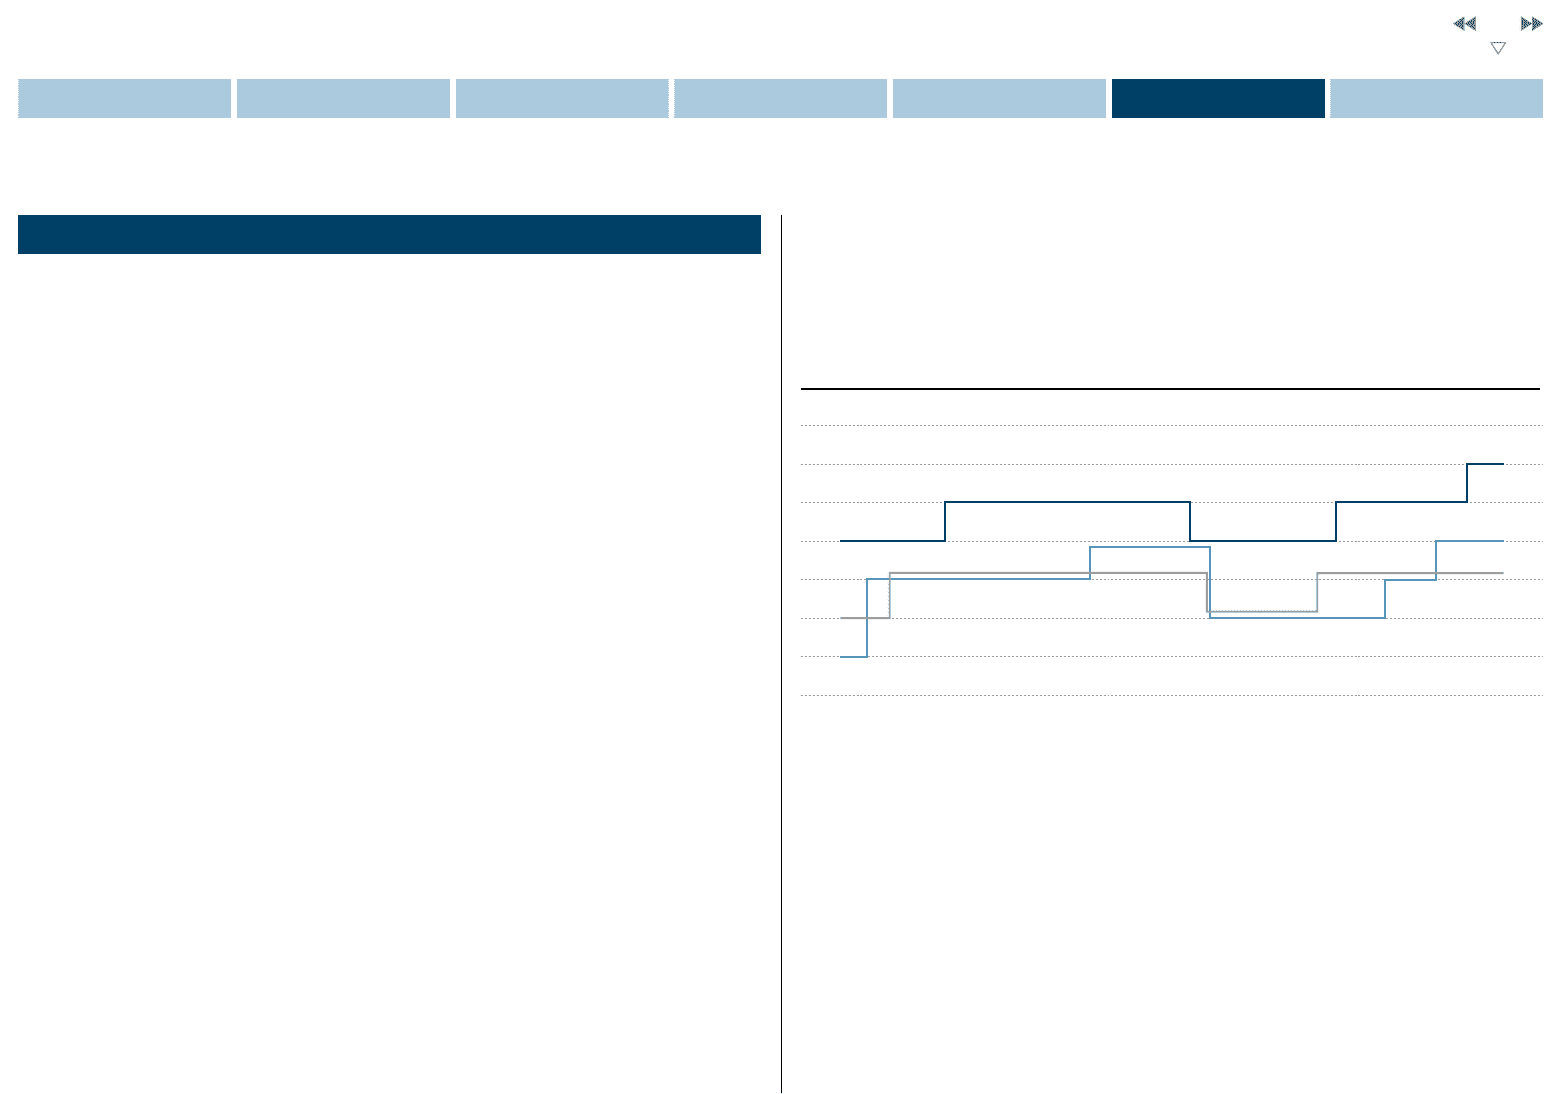
Corporate Ratings
Long-term credit rating
Nissan’s long-term credit rating with R&I is A+ with a stable outlook. S&P’s long-term credit rating for
Nissan is BBB+ with a stable outlook. Nissan’s credit rating with Moody’s is A3 with a stable outlook.
10/03 4/04 10/04 4/05 10/05
R&I
S&P
Moody’s
4/06 10/06 4/07 10/07 4/08 10/08 4/09 10/09 4/10 10/10 4/11 7/11 7/12 1/13
* Based on continuation of proportionate consolidation of China JV
26
NISSAN MOTOR CORPORATION ANNUAL REPORT 2014
PERFORMANCE
CONTENTS
CORPORATE FACE TIME
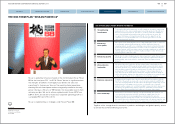
CEO MESSAGE
EXECUTIVE PROFILE
NISSAN POWER 88
CORPORATE GOVERNANCE