Nissan 2014 Annual Report Download - page 26
Download and view the complete annual report
Please find page 26 of the 2014 Nissan annual report below. You can navigate through the pages in the report by either clicking on the pages listed below, or by using the keyword search tool below to find specific information within the annual report.-
 1
1 -
2
-
3
-
4
-
5
-
6
-
7
-
8
-
9
-
10
-
11
-
12
-
13
-
14
-
15
-
 16
16 -
 17
17 -
 18
18 -
 19
19 -
 20
20 -
 21
21 -
 22
22 -
 23
23 -
 24
24 -
 25
25 -
 26
26 -
 27
27 -
 28
28 -
 29
29 -
 30
30 -
 31
31 -
 32
32 -
 33
33 -
 34
34
 |
 |

* Based on continuation of proportionate consolidation of China JV
523.5 605.7
+70.4
–266.5
–24.2 –36.8 –72.1 –38.8
+247.6
+202.6
800.0
600.0
400.0
200.0
0
2014201320122009 2010 2011
537.5
311.6
545.8 523.5
605.7
498.4535.0
12,000.0
6,000.0
9,000.0
3,000.0
0
2014201320122010 2011
8,773.1 9,409.0
7,517.3
9,629.6
11,434.8
10,482.5
10,790.0
2009
2014201320122010 2011
319.2
42.4
341.4 342.4
389.0 405.0
2009
600.0
450.0
300.0
150.0
0
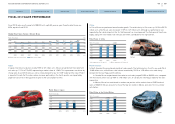
FISCAL 2013 FINANCIAL REVIEW
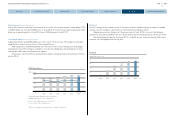
Net Sales (Management pro forma basis*)
For fiscal 2013, consolidated net sales
increased 18.7%, to 11.43 trillion yen.
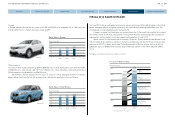
Operating Profit (Management pro forma basis*)
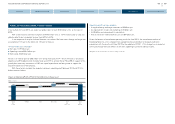
Consolidated operating profit totaled 605.7 billion yen, an increase of 15.7% from previous year. In
comparison to previous year’s consolidated operating profit, the variance was due to the following factors:
l The 247.6 billion yen foreign exchange impact reflects mainly the correction of the yen against the U.S.
dollar.
l Purchasing cost reduction efforts, including raw
materials, resulted in savings of 202.6 billion yen.
l Volume and mix produced a positive impact of
70.4 billion yen
l The increase in selling expenses, including
product enrichment costs, resulted in a 266.5
billion yen negative movement.
l R&D expenses increased by 24.2 billion yen.
l Manufacturing expenses increased by 36.8
billion yen.
l Warranty and recall expenses increased by 72.1
billion yen.
l Other items including remarketing had a negative
impact of 38.8 billion yen.
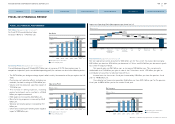
Net income (Management pro forma basis*)
Net non-operating income amounted to 53.3 billion yen for the current fiscal year, decreasing by
59.1 billion yen due to a 32.4 billion yen decrease in FX loss and 30.0 billion yen decrease in profit
loss under the equity method.
Net special gain was 26.0 billion yen, an increase of 38.6 billion yen. This was primarily
attributable to a 16.3 billion yen gain on sale of the CV business and a 12.2 billion yen gain on
contribution of securities to retirement benefit trust.
Income taxes for the current fiscal year increased by 3.5 billion yen from the previous fiscal
year to 149.8 billion yen.
Consolidated net income increased by 46.6 billion yen from 342.4 billion yen for the previous
fiscal year to 389.0 billion yen for the current fiscal year.
FISCAL 2013 FINANCIAL PERFORMANCE Impact on Operating Profit (Management pro forma basis*)
(Billions of yen)
FY12
O.P.
Purch. cost
reduction
(Including raw
material)
Selling exp. /
product
enrichment
MFG
exp.
FOREX Volume/
mix
R&D
exp.
Warranty &
Recall exp.
Other
Items
FY13
O.P.
Net income
(Billions of yen)
(FY)
(Forecast)
Operating Profit
(Billions of yen)
(FY)
(Forecast)
Net Sales
(Billions of yen)
(FY)
(Forecast)
Management pro forma basis*
China JV Equity basis
Management pro forma basis*
China JV Equity basis
Management pro forma basis*
China JV Equity basis
25
NISSAN MOTOR CORPORATION ANNUAL REPORT 2014
PERFORMANCE
CONTENTS
CORPORATE FACE TIME
CEO MESSAGE
EXECUTIVE PROFILE
NISSAN POWER 88
CORPORATE GOVERNANCE