Nissan 2014 Annual Report Download - page 32
Download and view the complete annual report
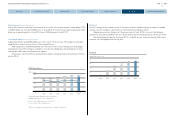
Please find page 32 of the 2014 Nissan annual report below. You can navigate through the pages in the report by either clicking on the pages listed below, or by using the keyword search tool below to find specific information within the annual report.-
 1
1 -
2
-
3
-
4
-
5
-
6
-
7
-
8
-
9
-
10
-
11
-
12
-
13
-
14
-
15
-
16
-
17
-
18
-
19
-
20
-
21
-
 22
22 -
 23
23 -
 24
24 -
 25
25 -
 26
26 -
 27
27 -
 28
28 -
 29
29 -
 30
30 -
 31
31 -
 32
32 -
 33
33 -
 34
34
 |
 |
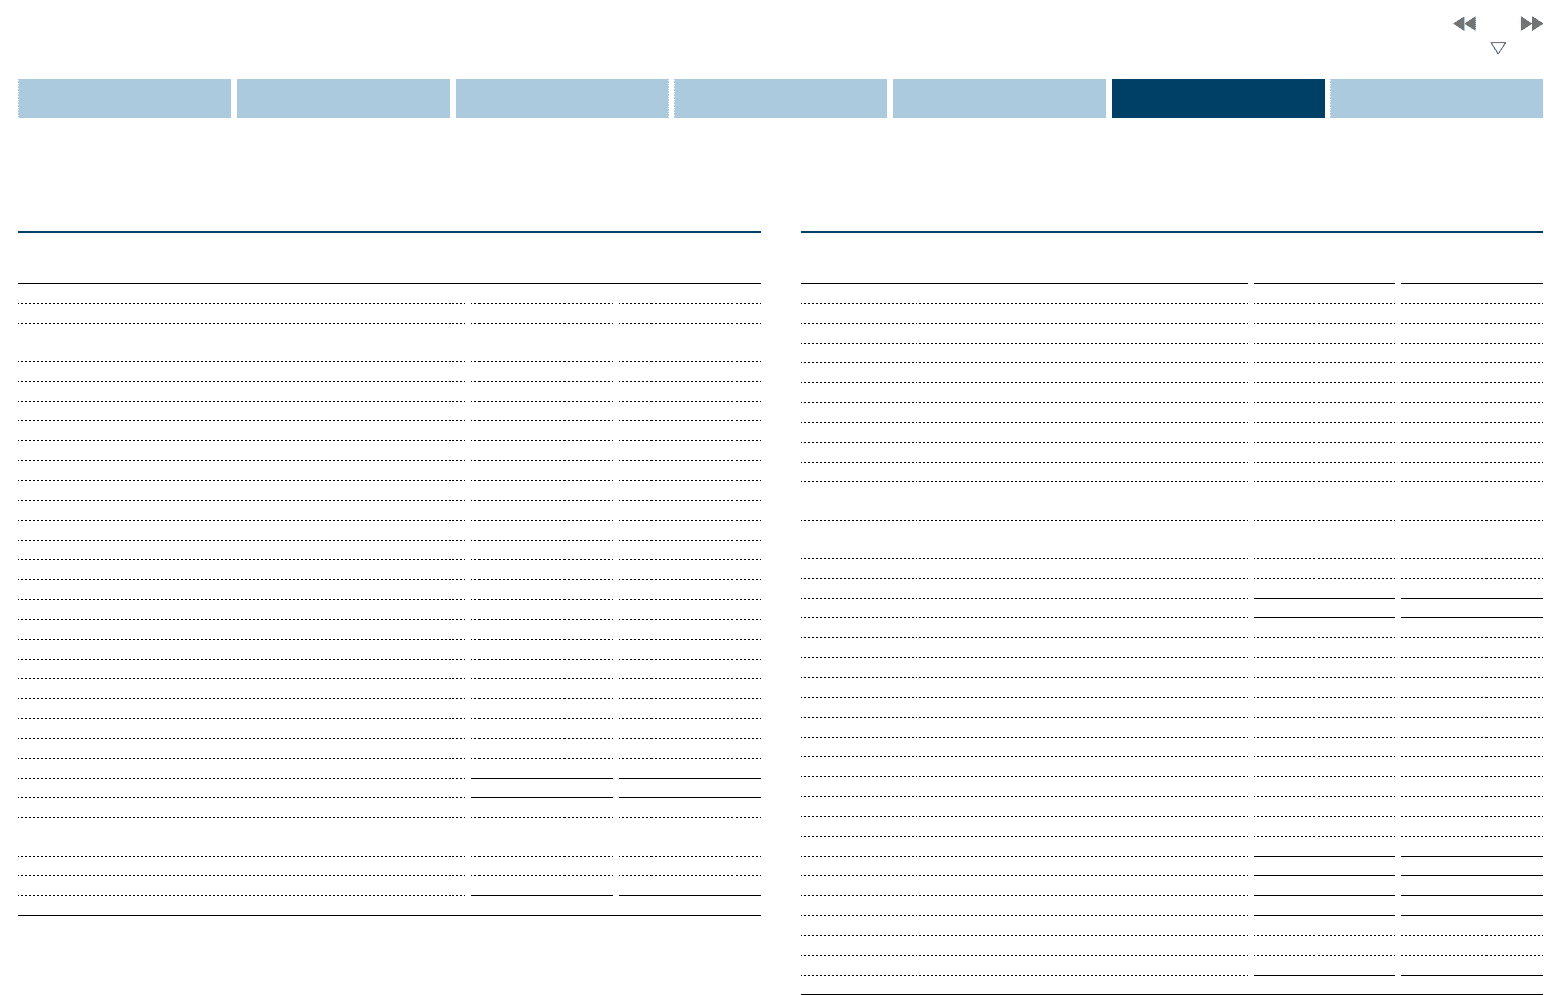
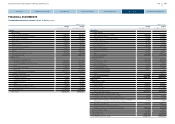
Consolidated statement of cash flows (China JV Equity basis)
(Millions of yen)
FY2012
(From April 1, 2012
to March 31, 2013)
FY2013
(From April 1, 2013
to March 31, 2014)
Cash flows from operating activities
Income before income taxes and minority interests 487,333 529,378
Depreciation and amortization (for fixed assets excluding leased
vehicles) 329,459 364,926
Depreciation and amortization (for long term prepaid expenses) 18,836 24,086
Depreciation and amortization (for leased vehicles) 219,155 288,276
Impairment loss 12,280 2,130
Gain on contribution of securities to retirement benefit trust
-
(12,175)
Increase (decrease) in allowance for doubtful receivables (6,283) 12,160
Provision for residual value risk of leased vehicles(net changes) 12,378 11,633
Interest and dividend income (15,948) (23,077)
Interest expense 84,025 101,451
Equity in losses (earnings) of affiliates (80,186) (78,815)
Loss (gain) on sales of fixed assets (9,755) (7,474)
Loss on disposal of fixed assets 8,247 11,456
Loss (gain) on sales of investment securities (1,520) (3,774)
Decrease (increase) in trade notes and accounts receivable 104,140 (173,228)
Decrease (increase) in sales finance receivables (550,158) (587,060)
Decrease (increase) in inventories (14,804) (38,057)
Increase (decrease) in trade notes and accounts payable (93,228) 334,367
Amortization of net retirement benefit obligation at transition 9,947 9,075
Retirement benefit expenses 31,767 37,701
Retirement benefit payments made against related accrual (44,287)
-
Payments made against net defined benefit liability
-
(36,658)
Other (2,804) 38,523
Subtotal 498,594 804,844
Interest and dividends received 15,814 20,654
Proceeds from dividends income from affiliates accounted for by
equity method 59,966 98,907
Interest paid (86,847) (99,861)
Income taxes paid (75,270) (96,421)
Net cash provided by operating activities 412,257 728,123
(Millions of yen)
FY2012
(From April 1, 2012
to March 31, 2013)
FY2013
(From April 1, 2013
to March 31, 2014)
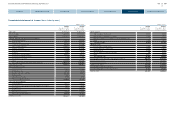
Cash flows from investing activities
Net decrease (increase) in short-term investments (25) (3,360)
Purchase of fixed assets (455,703) (551,808)
Proceeds from sales of fixed assets 59,714 79,578
Purchase of leased vehicles (709,995) (1,004,141)
Proceeds from sales of leased vehicles 323,615 465,501
Payments of long-term loans receivable (8,439) (1,292)
Collection of long-term loans receivable 239 254
Purchase of investment securities (33,628) (37,617)
Proceeds from sales of investment securities 2,200 2,223
Proceeds from (payments for) sales of subsidiaries' shares resulting
in changes in the scope of consolidation 15,106 (1,321)
Proceeds (parchase) from purchase of subsidiaries' shares
resulting in changes in the scope of consolidation ―972
Net decrease (increase) in restricted cash (22,727) (8,628)
Other (8,404) (20,777)
Net cash used in investing activities (838,047) (1,080,416)
Cash flows from financing activities
Net increase (decrease) in short-term borrowings 354,254 (19,920)
Proceeds from long-term borrowings 1,122,914 1,373,644
Proceeds from issuance of bonds 236,311 444,666
Repayments of long-term borrowings (952,033) (1,058,838)
Redemption of bonds (182,877) (181,628)
Proceeds from minority shareholders 9,514 9,599
Purchase of treasury stock (7) (11)
Proceeds from sales of treasury stock ―127
Repayments of lease obligations (52,941) (44,312)
Cash dividends paid (94,306) (115,265)
Cash dividends paid to minority shareholders (7,012) (11,137)
Net cash provided by financing activities 433,817 396,925
Effects of exchange rate changes on cash and cash equivalents 50,550 74,850
Increase (decrease) in cash and cash equivalents 58,577 119,482
Cash and cash equivalents at beginning of the period 652,944 711,901
Increase due to inclusion in consolidation 548 1,333
Decrease due to exclusion from consolidation (168) ―
Cash and cash equivalents at end of the period 711,901 832,716
31
NISSAN MOTOR CORPORATION ANNUAL REPORT 2014
PERFORMANCE
NISSAN MOTOR CORPORATION ANNUAL REPORT 2014
CONTENTS
CORPORATE FACE TIME
CEO MESSAGE
EXECUTIVE PROFILE
NISSAN POWER 88
CORPORATE GOVERNANCE