Navy Federal Credit Union 2013 Annual Report Download - page 33
Download and view the complete annual report
Please find page 33 of the 2013 Navy Federal Credit Union annual report below. You can navigate through the pages in the report by either clicking on the pages listed below, or by using the keyword search tool below to find specific information within the annual report.-
 1
1 -
2
-
3
-
4
-
5
-
6
-
7
-
8
-
9
-
10
-
11
-
12
-
13
-
14
-
15
-
16
-
17
-
18
-
19
-
20
-
21
-
22
-
 23
23 -
 24
24 -
 25
25 -
 26
26 -
 27
27 -
 28
28 -
 29
29 -
 30
30 -
 31
31 -
 32
32 -
 33
33 -
 34
34 -
 35
35 -
 36
36 -
 37
37 -
 38
38 -
 39
39 -
 40
40 -
 41
41 -
 42
42 -
 43
43 -
44
-
45
-
46
-
47
-
48
-
49
-
50
-
51
-
52
-
53
-
54
-
55
-
56
-
57
-
58
-
59
-
60
-
61
-
62
-
63
-
64
-
65
-
66
-
67
-
68
-
69
-
70
-
71
-
72
-
73
 |
 |

Navy Federal Credit Union • 2013 Financial Section
13
2013 ANNUAL REPORT
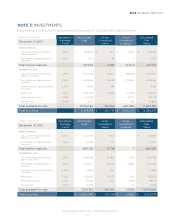
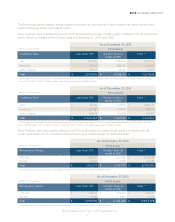
NOTE 3:
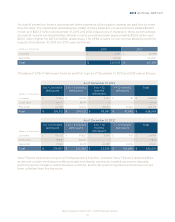
Navy Federal’s HTM and AFS securities as of December 31, 2013 and 2012 were as follows:
(dollars in thousands) Weighted-
Average
Yield
Amortized
Cost
Unrealized
Unrealized
(Losses)
Estimated
Fair
U.S. government and federal
agency securities 2.32% $ 359,922 $ 4,417 $ (4,506) $ 359,833
Residential mortgage-backed
securities 0.58% 17,112 68 (1) 17,179
Available-for-sale
U.S. government and federal
agency securities 2.19% 5,047,768 111,077 (88,925) 5,069,920
Residential mortgage-backed
securities 2.58% 5,165,966 63,346 (170,844) 5,058,468
Commercial mortgage-backed
securities 3.07% 13,976 485 — 14,461
Bank notes 1.90% 1,552,096 24,326 (14,692) 1,561,730
Municipal securities 3.28% 210,935 — (23,159) 187,776
Mutual funds -0.08% 11,043 — (163) 10,880
Total available-for-sale
$ $ $ $
(dollars in thousands) Weighted-
Average
Yield
Amortized
Cost
Unrealized
Unrealized
(Losses)
Estimated
Fair
U.S. government and federal
agency securities 2.47% $ 440,256 $ 15,612 $ — $ 455,868
Residential mortgage-backed
securities 0.62% 29,496 126 — 29,622
—
Available-for-sale
U.S. government and federal
agency securities 2.30% 5,998,082 304,812 (1,106) 6,301,788
Residential mortgage-backed
securities 2.12% 4,512,747 163,130 (1,884) 4,673,993
Commercial mortgage-backed
securities 2.90% 13,969 1,019 — 14,988
Bank notes 2.33% 1,525,505 55,037 (791) 1,579,751
Municipal securities 3.33% 95,952 2,412 (289) 98,075
Mutual funds -0.07% 10,939 — (11) 10,928
Total available-for-sale
$ $ $ $