Motorola 2001 Annual Report Download - page 3
Download and view the complete annual report
Please find page 3 of the 2001 Motorola annual report below. You can navigate through the pages in the report by either clicking on the pages listed below, or by using the keyword search tool below to find specific information within the annual report.-
 1
1 -
 2
2 -
 3
3 -
 4
4 -
 5
5 -
 6
6 -
 7
7 -
 8
8 -
 9
9 -
 10
10 -
 11
11 -
 12
12 -
 13
13 -
 14
14 -
15
-
16
-
17
-
18
-
19
-
20
-
21
-
22
-
23
-
24
-
25
-
26
-
27
-
28
-
29
-
30
-
31
-
32
-
33
-
34
-
35
-
36
 |
 |

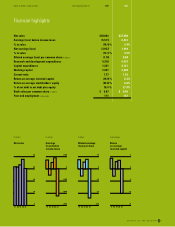
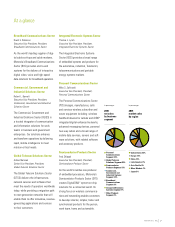
In billions
Net sales
In millions
Earnings
(loss) before
income taxes
In dollars
Diluted earnings
(loss) per share
In percentages
Return
on average
invested capital
0
10
20
30
40
97 98 99 00 01
-7500
-5000
-2500
0
2500
97 98 99 00 01
-2.25
-1.5
-.75
0
.75
97 98 99 00 01
-27
-18
-9
0
9
97 98 99 00 01
Net sales $30,004 $37,580
Earnings (loss) before income taxes (5,511) 2,231
% to sales (18.4) % 5.9%
Net earnings (loss) (3,937) 1,318
% to sales (13.1) % 3.5%
Diluted earnings (loss) per common share (in dollars) (1.78) 0.58
Research and development expenditures 4,318 4,437
Capital expenditures 1,321 4,131
Working capital 7,451 3,628
Current ratio 1.77 1.22
Return on average invested capital (18.0) % 6.3%
Return on average stockholders’ equity (24.8) % 6.6%
% of net debt to net debt plus equity 18.4 % 27.4%
Book value per common share (in dollars) $««««6.07 $««««8.49
Year-end employment (in thousands) 111 147
Financial highlights
Dollars in millions, except as noted Years ended December 31, 2001 2000
MOTOROLA, INC. AND SUBSIDIARIES 1