Marks and Spencer 2002 Annual Report Download - page 9
Download and view the complete annual report
Please find page 9 of the 2002 Marks and Spencer annual report below. You can navigate through the pages in the report by either clicking on the pages listed below, or by using the keyword search tool below to find specific information within the annual report.-
 1
1 -
 2
2 -
 3
3 -
 4
4 -
 5
5 -
 6
6 -
 7
7 -
 8
8 -
 9
9 -
 10
10 -
 11
11 -
 12
12 -
 13
13 -
 14
14 -
 15
15 -
 16
16 -
 17
17 -
 18
18 -
 19
19 -
 20
20 -
21
-
22
-
23
-
24
-
25
-
26
-
27
-
28
-
29
-
30
-
31
-
32
-
33
-
34
-
35
-
36
-
37
-
38
-
39
-
40
-
41
-
42
-
43
-
44
-
45
-
46
-
47
-
48
-
49
-
50
-
51
-
52
-
53
-
54
-
55
-
56
 |
 |

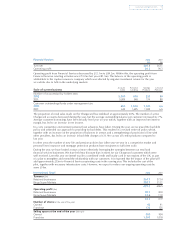
Earnings per share
Earnings per share for the period was 5.4p (last year a loss per share of 0.2p). An adjusted earnings per share figure
of 16.3p (last year 11.2p) has been calculated excluding the effect of exceptional items. Details of the calculation
are given in note 10.
Dividend
A final dividend of 5.8p (last year 5.3p) is proposed, making the total dividend for the year 9.5p (last year 9.0p).
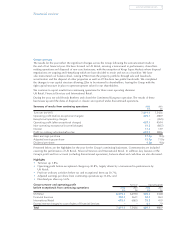
Cash flow
Analysis of free cash flow (operating cash flow before acquisitions and disposals and transactions with shareholders)
is as follows:
Cash flow analysis 2002 2001
£m £m
Cash inflow from Retail operating activities 853.5 654.2
Cash inflow from Financial Services operating activities 240.2 22.2
Capital expenditure (285.7) (269.8)
Proceeds from asset disposals 455.6 18.9
Net interest received 36.8 13.1
Tax paid (179.4) (164.6)
Free cash flow 1,121.0 274.0
The cash inflow from Financial Services operating activities is stated after a £76.2m decrease this year (last year a
£117.8m increase) in loans and advances to customers.
During the year, the Group acquired tangible fixed assets totalling £290.5m (last year £255.7m). After taking into
account the timing of payments the cash outflow for capital expenditure was £285.7m (last year £269.8m). Of this,
£61.7m was spent on new space and £122.0m on store modernisation. Capital expenditure is expected to be
broadly level in the coming financial year.
Net proceeds from asset disposals include £344.1m from the sale and leaseback of properties, together with the
proceeds from other asset disposals. The sale and leaseback transaction has a committed rental liability in the first
year of approximately £25m rising by 1.95% per annum.
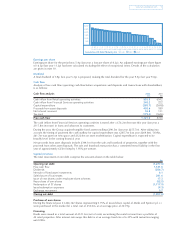
Capital structure
The total movements in net debt comprise the amounts shown in the table below:
£m
Opening net debt (1,277.8)
Free cash flow 1,121.0
Dividends (256.7)
Net sale of fixed asset investments 6.1
Sale/closure of businesses 261.6
Issue of new shares under employee share schemes 17.3
Repurchase of own shares (52.0)
Redemption of ‘B’ shares (1,717.9)
Issue/redemption expenses (9.3)
Exchange movement 0.7
Closing net debt (1,907.0)
Purchase of own shares
During the financial year, 21,446,162 shares (representing 0.75% of issued share capital of Marks and Spencer p.l.c.)
were purchased in the market for a total cost of £52.0m, at an average price of 241.9p.
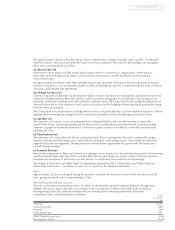
Financing
Bonds were issued in a total amount of £321.5m (net of costs) securitising the rental income from a portfolio of
45 retail properties. After interest rate swaps this debt is at an average fixed rate of 6.32% with maturities ranging
until 2026.
www.marksandspencer.com 7
3,000
2,500
2,000
1,500
1,000
500
A
02
J
02
M
02
J
02
A
02
S
02
N
02
D
02
J
03
F
03
M
03
J
03
O
03
N
03
J
04
J
06
J
06
A
06
N
06
D
06
J
07
N
11
S
15
D
26
F
04
A
04
D
05
J
06
Cumulative UK Debt Maturity £m USD GBP EUR