Marks and Spencer 2002 Annual Report Download - page 6
Download and view the complete annual report
Please find page 6 of the 2002 Marks and Spencer annual report below. You can navigate through the pages in the report by either clicking on the pages listed below, or by using the keyword search tool below to find specific information within the annual report.-
 1
1 -
 2
2 -
 3
3 -
 4
4 -
 5
5 -
 6
6 -
 7
7 -
 8
8 -
 9
9 -
 10
10 -
 11
11 -
 12
12 -
 13
13 -
 14
14 -
 15
15 -
 16
16 -
 17
17 -
18
-
19
-
20
-
21
-
22
-
23
-
24
-
25
-
26
-
27
-
28
-
29
-
30
-
31
-
32
-
33
-
34
-
35
-
36
-
37
-
38
-
39
-
40
-
41
-
42
-
43
-
44
-
45
-
46
-
47
-
48
-
49
-
50
-
51
-
52
-
53
-
54
-
55
-
56
 |
 |

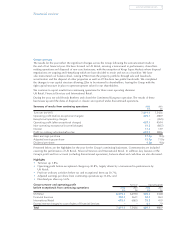
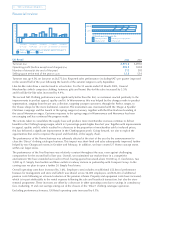
Financial review
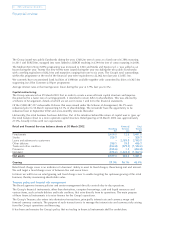
UK Retail 2002 2001
Turnover (£m) 6,575.2 6,293.0
Operating profit (before exceptional charges) (£m) 505.2 334.8
Number of stores (at the end of the year) 312 303
Selling space at the end of the year (m sq ft) 12.2 12.4
Turnover was up 4.5% on last year at £6,575.2m. Reported sales performance (including VAT) per quarter improved
in the second half of the year following the launch of the autumn ranges in early September.
Like-for-like sales show a similar trend to actual sales. For the 52 weeks ended 30 March 2002, General
Merchandise (which comprises clothing, footwear, gifts and home) like-for-like sales increased by 3.5%
and Food like-for-like sales increased by 4.4%.
The second half Clothing performance was significantly better than the first, as customers reacted positively to the
improvements in product appeal, quality and fit. In Womenswear, this was helped by the changes made to product
segmentation, ranging from the per una collection, targeting younger customers, through the Perfect ranges, to
the Classic shops for the more traditional customer. The momentum was maintained with the ‘Magic & Sparkle’
Christmas campaign and the launch of the spring ranges in January, together with the Blue Harbour branding of
the casual Menswear ranges. Customer response to the spring ranges in Womenswear and Menswear has been
encouraging and has continued the progress made.
The actions taken to consolidate the supply base and produce more merchandise overseas continue to deliver
benefits in the Clothing buying margin, which is 3 percentage points higher than last year. Together with improvements
in appeal, quality and fit, which resulted in a decrease in the proportion of merchandise sold at reduced prices,
this has delivered a significant improvement in the Clothing gross profit. Going forward, we aim to exploit the
opportunities that exist to improve the speed and flexibility of the supply chain.
The performance of the Home business was adversely affected at the start of the year by the announcement to
close the ‘Direct’ clothing catalogue business. This impact was short-lived and sales subsequently improved, further
helped by two Chargecard events in October and February. In addition, we have created 27 Home concept stores
within our larger stores.
The performance of the Food business was relatively constant throughout the year, even against challenging
comparatives for the second half of last year. Overall, we maintained our market share in a competitive
environment. We have extended our reach in Food, having opened two stand-alone 10,000 sq. ft. food stores, two
3,000 sq. ft. Simply Food outlets and three outlets at railway stations in partnership with Compass Group. In the
coming year we plan to open a further 20 Simply Food stores.
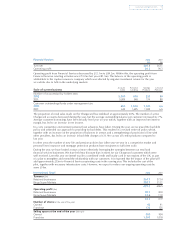
Overall operating costs have increased by 3.6%. Employee costs includes an additional £52.8m of performance
bonuses for management and store staff which was shared across 56,000 employees, and £26.0m of additional
pension costs following an actuarial valuation of the pension scheme. Property and equipment costs have increased,
which is in part attributable to the rental expense following the sale and leaseback transaction, but also the store
renewal programme. These increases are offset by a decrease in other operating costs due to savings in consultancy
fees, marketing, IT and cost savings arising out of the closure of the ‘Direct’ clothing catalogue operation.
Excluding performance bonuses, UK Retail operating costs increased by 0.5%.
4Marks and Spencer Group p.l.c.
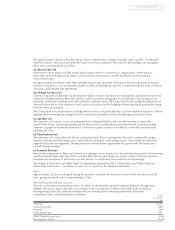
Depreciation Other costs
2002
2001
Employee costs Property and equipment
UK Retail operating costs £m
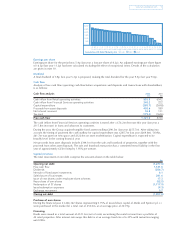
Clothing Home Food
20
15
5
0
10
-5
-10
UK Retail sales performance per quarter against last year %
14 weeks
to 7 July
12 weeks
to 29 Sept
15 weeks
to 12 Jan
11 weeks
to 30 March
52 weeks
to 30 March