Macy's 2000 Annual Report Download - page 4
Download and view the complete annual report
Please find page 4 of the 2000 Macy's annual report below. You can navigate through the pages in the report by either clicking on the pages listed below, or by using the keyword search tool below to find specific information within the annual report.-
 1
1 -
 2
2 -
 3
3 -
 4
4 -
 5
5 -
 6
6 -
 7
7 -
 8
8 -
 9
9 -
 10
10 -
 11
11 -
 12
12 -
 13
13 -
 14
14 -
 15
15 -
16
-
17
-
18
 |
 |

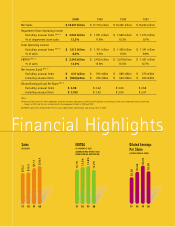
2000 1999 1998 1997
Net Sales $ 18.407 billion $ 17.716 billion $ 15.365 billion $ 15.220 billion
Department Store Operating Income
Excluding unusual items (Note 1) $ 2.004 billion $ 1.871 billion $ 1.589 billion $ 1.473 billion
% of department store sales 12.2% 11.8% 10.3% 9.7%
Total Operating Income
Excluding unusual items (Note 1) $ 1.512 billion $ 1.701 billion $ 1.455 billion $ 1.341 billion
% of sales 8.2% 9.6% 9.5% 8.8%
EBITDA (Note 2) $ 2.245 billion $ 2.439 billion $ 2.079 billion $ 1.931 billion
% of sales 12.2% 13.8% 13.5% 12.7%
Net Income (Loss) (Note 1)
Excluding unusual items $ 637 million $ 795 million $ 685 million $ 575 million
Including unusual items $ (184) million $ 795 million $ 662 million $ 536 million
Diluted Earnings (Loss) Per Share (Note 1)
Excluding unusual items $ 3.08 $ 3.62 $ 3.06 $ 2.58
Including unusual items $ (.90) $ 3.62 $ 2.96 $ 2.41
Notes:
(1) Unusual items represent, where applicable, inventory valuation adjustments related to the Fingerhut restructuring in 2000, asset impairment and restructuring
charges in 2000, and the loss associated with the prepayment of debt in 1998 and 1997.
(2) EBITDA represents earnings before interest, taxes, depreciation, amortization, and unusual items in 2000.
97 98 99 00 97 98 99 00 97 98 99 00
$15.2
$15.4
$17.7
$18.4
12.7%
13.5%
13.8%
12.2%
$2.58
$3.06
$3.62
$3.08
Sales
IN BILLIONS
Diluted Earnings
Per Share
(EXCLUDES UNUSUAL ITEMS)
EBITDA
AS A PERCENT OF SALES
(EARNINGS BEFORE INTEREST, TAXES,
DEPRECIATION AND AMORTIZATION)
Financial Highlights