Louis Vuitton 2006 Annual Report Download - page 9
Download and view the complete annual report
Please find page 9 of the 2006 Louis Vuitton annual report below. You can navigate through the pages in the report by either clicking on the pages listed below, or by using the keyword search tool below to find specific information within the annual report.-
 1
1 -
 2
2 -
 3
3 -
 4
4 -
 5
5 -
 6
6 -
 7
7 -
 8
8 -
 9
9 -
 10
10 -
 11
11 -
 12
12 -
 13
13 -
 14
14 -
 15
15 -
 16
16 -
 17
17 -
 18
18 -
 19
19 -
 20
20 -
21
-
22
-
23
-
24
-
25
-
26
-
27
-
28
-
29
-
30
-
31
-
32
-
33
-
34
-
35
-
36
-
37
-
38
-
39
-
40
-
41
-
42
-
43
-
44
-
45
-
46
-
47
-
48
-
49
-
50
-
51
-
52
-
53
-
54
-
55
-
56
-
57
-
58
-
59
-
60
-
61
-
62
-
63
-
64
-
65
-
66
-
67
-
68
-
69
-
70
-
71
-
72
-
73
-
74
-
75
-
76
-
77
-
78
-
79
-
80
-
81
-
82
 |
 |

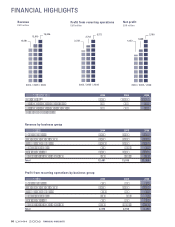
Group share of net profit
EUR million
2004 / 2005 / 2006
1,194
1,440
1,879
Capital expenditures (2)
EUR million
2004 / 2005 / 2006
2.55
3.06 3.98
Basic group share
of net profit per share
EUR
L
V
L
V
M
H
L
V
V
M
H
L
V
M
M
H
L
V
M
H
V
M
H
M
H
L
V
H
L
V
M
H
L
V
M
M
H
L
V
M
H
H
L
V
M
H
L
V
M
H
L
V
V
M
H
L
V
M
M
H
L
V
M
H
H
L
V
M
H
L
V
M
H
L
V
V
M
H
L
V
M
M
H
L
V
M
H
H
L
V
M
H
FINANCIAL HIGHLIGHTS
LVM H 2 0 0 6
07
Revenue by currency
%
Revenue by geographic region of delivery
%
■France 15%
■Rest of Europe 22%
■United States 26%
■Japan 13%
■Rest of Asia 17%
■Other markets 7%
Store network
at December 31, 2006
France 288
Rest of Europe 456
North America 409
South America 19
Japan 278
Rest of Asia 363
Pacific Region 31
Africa and Middle East 15
Number of stores
2004 / 2005 / 2006
1,693
1,723 1,859
2004 / 2005 / 2006
640
707 771
(2) Acquisition of tangible
and intangible fixed assets.
■Euro 30%
■US Dollar 32%
■Yen 13%
■Hong Kong Dollar 3%
■Other currencies 22%
Cash flow from operations
EUR million
2004 / 2005 / 2006
2,708
3,089 3,504