Loreal 2012 Annual Report Download - page 91
Download and view the complete annual report
Please find page 91 of the 2012 Loreal annual report below. You can navigate through the pages in the report by either clicking on the pages listed below, or by using the keyword search tool below to find specific information within the annual report.-
 1
1 -
2
-
3
-
4
-
5
-
6
-
7
-
8
-
9
-
10
-
11
-
12
-
13
-
14
-
15
-
16
-
17
-
18
-
19
-
20
-
21
-
22
-
23
-
24
-
25
-
26
-
27
-
28
-
29
-
30
-
31
-
32
-
33
-
34
-
35
-
36
-
37
-
38
-
39
-
40
-
41
-
42
-
43
-
44
-
45
-
46
-
47
-
48
-
49
-
50
-
51
-
52
-
53
-
54
-
55
-
56
-
57
-
58
-
59
-
60
-
61
-
62
-
63
-
64
-
65
-
66
-
67
-
68
-
69
-
70
-
71
-
72
-
73
-
74
-
75
-
76
-
77
-
78
-
79
-
80
-
 81
81 -
 82
82 -
 83
83 -
 84
84 -
 85
85 -
 86
86 -
 87
87 -
 88
88 -
 89
89 -
 90
90 -
 91
91 -
 92
92 -
 93
93 -
 94
94 -
 95
95 -
 96
96
 |
 |

(At December 31st, 2012)
(1) Non-recurring items include mainly capital gains and losses on long-term asset disposals, impairment of long-term assets, restructuring costs and elements relating to
identified operational incomes and expenses, non-recurring and significant regarding the consolidated performance. (2) Diluted net earnings per share excluding non-
recurring items, after non-controlling interests. (3) Dividend proposed to the Annual General Meeting of April 26th, 2013. (4) On the number of shares at December 31st, 2012,
i.e. 608,810,827 shares. (5) Dividend distribution rate based on diluted net profit excluding non-recurring items per share. (6) Based on the dividend proposed to the Annual
General Meeting of April 26th, 2013.
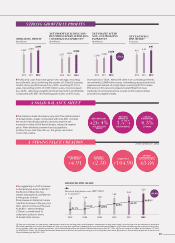
❚ Profits and cash flow have grown very strongly, reaching
record levels, and confirming the power of L’Oréal’s business
model. Gross profit increased by +9.5%, reaching 70.7% of
sales. Operating profit, at 3,697 million euros, has increased
by +12.3%, reflecting a significant improvement in profitability
compared with 2011. Net earnings per share, at 4.91 euros,
increased by +13.6%. Net profit after non-controlling interests
amounted to 2,868 million euros. Advertising and promotional
expenses remained at a high level; reaching 30.2% of sales.
Efficiency in this area increased, benefitting from new
methods of communications as well as the opportunities
provided by digital media.
❚ The balance sheet structure is very solid. The reinforcement
of shareholders’ equity compared with end-2011 is mainly
the result of profit allocated to reserves and the net
increase in value of the Sanofi shares, valued at market
price. After dividend payment and acquisitions
(mainly CADUM and URBAN DECAY), the group recorded
a net cash surplus.
❚ By suggesting a +15% increase
in dividend per share to €2.30 (3),
the Board of Directors has
clearly expressed its confidence
in the group’s future.
This increase in dividend means
a further increase in the pay-out
ratio, which comes out this year
to 46.8%(6), demonstrating
L’Oréal’s commitment to
a dynamic policy in terms
of shareholder returns.
STRONG GROWTH IN PROFITS
A SOLID BALANCE SHEET
A STRONG VALUE CREATION
NET PROFIT AFTER
NON-CONTROLLING
INTERESTS
(€ millions)
NET PROFIT EXCLUDING NON-
RECURRING ITEMS AFTER NON-
CONTROLLING INTERESTS(1)
(€ millions)
2010 2011 2012
NET EARNINGS
PER SHARE(2)
(in euros)
2010 2011 2012
OPERATING PROFIT
(€ millions)
20122010 2011
+17.6%
2010 2011 2012
+26.4%
NET CASH FLOW:
AT 2.58 BILLON
EUROS
63.86
MARKET
CAPITALISATION(4)
(IN BILLIONS OF EUROS)
4.3%
CAPITAL
EXPENDITURE
OF SALES
104.90
SHARE PRICE
NET CASH
SURPLUS OF
1,575
MILLION EUROS
DIVIDEND(3)
PER SHARE
2.30
NET EARNINGS(2)
PER SHARE
4.91
3,697
3,293
3,057 2,868
2,438
2,240
4.91
4.32
4.01
2,972
2,583
2,371
Dividend distribution rate 2007-2012
as % of profit (5)
DIVIDEND PER SHARE
+15.0%
41.1% 41.3% 43.9% 44.9% 46.3%
46.8%(6)
1.38 1.44 1.50
1.80 2.00
2007 2008 2009 2010 2 011 2012
2.30
89