Kroger 2014 Annual Report Download - page 88
Download and view the complete annual report
Please find page 88 of the 2014 Kroger annual report below. You can navigate through the pages in the report by either clicking on the pages listed below, or by using the keyword search tool below to find specific information within the annual report.-
 1
1 -
2
-
3
-
4
-
5
-
6
-
7
-
8
-
9
-
10
-
11
-
12
-
13
-
14
-
15
-
16
-
17
-
18
-
19
-
20
-
21
-
22
-
23
-
24
-
25
-
26
-
27
-
28
-
29
-
30
-
31
-
32
-
33
-
34
-
35
-
36
-
37
-
38
-
39
-
40
-
41
-
42
-
43
-
44
-
45
-
46
-
47
-
48
-
49
-
50
-
51
-
52
-
53
-
54
-
55
-
56
-
57
-
58
-
59
-
60
-
61
-
62
-
63
-
64
-
65
-
66
-
67
-
68
-
69
-
70
-
71
-
72
-
73
-
74
-
75
-
76
-
77
-
 78
78 -
 79
79 -
 80
80 -
 81
81 -
 82
82 -
 83
83 -
 84
84 -
 85
85 -
 86
86 -
 87
87 -
 88
88 -
 89
89 -
 90
90 -
 91
91 -
 92
92 -
 93
93 -
 94
94 -
 95
95 -
 96
96 -
 97
97 -
 98
98 -
99
-
100
-
101
-
102
-
103
-
104
-
105
-
106
-
107
-
108
-
109
-
110
-
111
-
112
-
113
-
114
-
115
-
116
-
117
-
118
-
119
-
120
-
121
-
122
-
123
-
124
-
125
-
126
-
127
-
128
-
129
-
130
-
131
-
132
-
133
-
134
-
135
-
136
-
137
-
138
-
139
-
140
-
141
-
142
 |
 |

A-23
LI Q U I D I T Y A N D C A P I T A L R E S O U R C E S
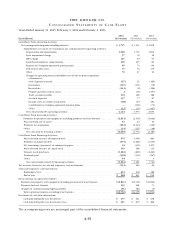
Cash Flow Information
Net cash provided by operating activities
We generated $4.2 billion of cash from operations in 2014, compared to $3.6 billion in 2013 and
$3.0 billion in 2012. The cash provided by operating activities came from net earnings including non-
controlling interests adjusted primarily for non-cash expenses of depreciation and amortization, the LIFO
charge and changes in working capital. The increase in net cash provided by operating activities in 2014,
compared to 2013, resulted primarily due to an increase in net earnings including non-controlling interests,
which include the results of Harris Teeter, an increase in non-cash items, a reduction in contributions to
Company-sponsored pension plans and changes in working capital. The increase in non-cash items in 2014,
as compared to 2013, was primarily due to increases in depreciation and amortization expense and the
LIFO charge.
Cash provided (used) by operating activities for changes in working capital was ($49) million in 2014,
compared to $63 million in 2013 and ($211) million in 2012. The increase in cash used by operating activities
for changes in working capital in 2014, compared to 2013, was primarily due to an increase in cash used for
receivables and a decrease in cash provided by trade accounts payables, partially offset by an increase in cash
provided by accrued expenses.
The increase in net cash provided by operating activities in 2013, compared to 2012, resulted primarily
due to changes in working capital and long-term liabilities. The increase in cash provided by operating
activities for changes in working capital in 2013, compared to 2012, was primarily due to a decrease in cash
used for deposits in-transit, prepaid expenses and receivables. The use of cash for the payment of long-term
liabilities decreased in 2013, as compared to 2012, primarily due to our funding of the remaining unfunded
actuarial accrued liability for the UFCW Consolidated Pension Plan in 2012.
The amount of cash paid for income taxes increased in 2014, compared to 2013, primarily due to an
increase in net earnings including non-controlling interests. The amount of cash paid for income taxes
increased in 2013, compared to 2012, primarily due to additional deductions taken in 2012 related to the
funding of our pension contributions and union health benefits.
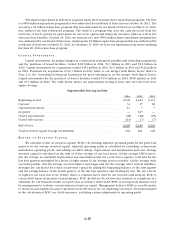
Net cash used by investing activities
Cash used by investing activities was $3.1 billion in 2014, compared to $4.8 billion in 2013 and
$2.2 billion in 2012. The amount of cash used by investing activities decreased in 2014, compared to 2013, due
to decreased payments for acquisitions, offset primarily by increased payments for capital investments. The
amount of cash used by investing activities increased in 2013, compared to 2012, due to increased payments
for capital investments and acquisitions. Capital investments, including payments for lease buyouts and
excluding acquisitions, were $2.8 billion in 2014, $2.3 billion in 2013 and $2.1 billion in 2012. Acquisitions
were $252 million in 2014, $2.3 billion in 2013 and $122 million in 2012. The decrease in payments for
acquisitions in 2014, compared to 2013, and the increase in payments for acquisitions in 2013, compared to
2012, was primarily due to our merger with Harris Teeter in 2013. Refer to the “Capital Investments” section
for an overview of our supermarket storing activity during the last three years.
Net cash provided (used) by financing activities
Financing activities provided (used) cash of ($1.2) billion in 2014, $1.4 billion in 2013 and ($721) million
in 2012. The increase in the amount of cash used for financing activities in 2014, compared to 2013, was
primarily related to decreased proceeds from the issuance of long-term debt and increased treasury stock
purchases, offset partially by decreased payments on long-term debt. The increase in cash provided by
financing activities in 2013, compared to 2012, was primarily related to increased proceeds from the issuance
of long-term debt, primarily to finance our merger with Harris Teeter, and a reduction in payments on long-
term debt and treasury stock purchases, offset partially by net payments on our commercial paper program.
Proceeds from the issuance of long-term debt were $576 million in 2014, $3.5 billion in 2013 and $863 million
in 2012. Net borrowings (payments) provided from our commercial paper program were $25 million in 2014,