Kroger 2014 Annual Report Download - page 79
Download and view the complete annual report
Please find page 79 of the 2014 Kroger annual report below. You can navigate through the pages in the report by either clicking on the pages listed below, or by using the keyword search tool below to find specific information within the annual report.-
 1
1 -
2
-
3
-
4
-
5
-
6
-
7
-
8
-
9
-
10
-
11
-
12
-
13
-
14
-
15
-
16
-
17
-
18
-
19
-
20
-
21
-
22
-
23
-
24
-
25
-
26
-
27
-
28
-
29
-
30
-
31
-
32
-
33
-
34
-
35
-
36
-
37
-
38
-
39
-
40
-
41
-
42
-
43
-
44
-
45
-
46
-
47
-
48
-
49
-
50
-
51
-
52
-
53
-
54
-
55
-
56
-
57
-
58
-
59
-
60
-
61
-
62
-
63
-
64
-
65
-
66
-
67
-
68
-
 69
69 -
 70
70 -
 71
71 -
 72
72 -
 73
73 -
 74
74 -
 75
75 -
 76
76 -
 77
77 -
 78
78 -
 79
79 -
 80
80 -
 81
81 -
 82
82 -
 83
83 -
 84
84 -
 85
85 -
 86
86 -
 87
87 -
 88
88 -
 89
89 -
90
-
91
-
92
-
93
-
94
-
95
-
96
-
97
-
98
-
99
-
100
-
101
-
102
-
103
-
104
-
105
-
106
-
107
-
108
-
109
-
110
-
111
-
112
-
113
-
114
-
115
-
116
-
117
-
118
-
119
-
120
-
121
-
122
-
123
-
124
-
125
-
126
-
127
-
128
-
129
-
130
-
131
-
132
-
133
-
134
-
135
-
136
-
137
-
138
-
139
-
140
-
141
-
142
 |
 |
A-14
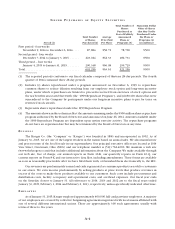
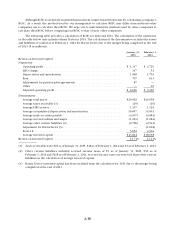
substitute for our financial results as reported in accordance with GAAP. FIFO operating profit is an important
measure used by management to evaluate operational effectiveness. Management believes FIFO operating
profit is a useful metric to investors and analysts because it measures our day-to-day merchandising and
operational effectiveness. Since fuel discounts are earned based on in-store purchases, fuel operating profit
does not include fuel discounts, which are allocated to our in-store supermarket location departments. We
also derive OG&A, rent and depreciation and amortization expenses through the use of estimated allocations
in the calculation of fuel operating profit.
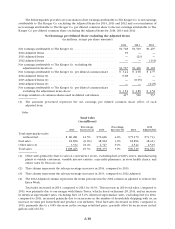
FIFO operating profit was $3.3 billion in 2014 and $2.8 billion in 2013 and 2012. Excluding the Extra
Week in 2012, FIFO operating profit was $2.7 billion. FIFO operating profit, as a percentage of sales, was
3.03% in 2014, 2.82% in 2013 and 2.92% in 2012. FIFO operating profit, as a percentage of sales excluding the
Extra Week in 2012, was 2.87%. FIFO operating profit, excluding the 2014, 2013 and 2012 Adjusted Items and
the 2014 Contributions, was $3.5 billion in 2014, $2.8 billion in 2013 and $2.6 billion in 2012. FIFO operating
profit, as a percentage of sales excluding the 2014, 2013 and 2012 Adjusted Items and the 2014 Contributions,
was 3.24% in 2014, 2.84% in 2013 and 2.75% in 2012.
Retail fuel sales lower our overall FIFO operating profit rate due to the very low FIFO operating profit
rate, as a percentage of sales, of retail fuel sales compared to non-fuel sales. FIFO operating profit, as a
percentage of sales excluding fuel, the 2014 Contributions and the 2014 Adjusted Items, increased 10 basis
points in 2014, compared to 2013, adjusted for the 2013 Adjusted Items. The increase in our adjusted FIFO
operating profit rate in 2014, compared to 2013, was primarily due to the effect of our merger with Harris
Teeter and a reduction in warehouse and transportation costs, improvements in OG&A, rent and depreciation
and amortization expense, as a percentage of sales, partially offset by continued investments in lower prices
for our customers. FIFO operating profit, as a percentage of sales excluding fuel and the 2013 Adjusted Items,
increased 11 basis points in 2013, compared to 2012, adjusted for the 2012 Adjusted Items. The increase in our
adjusted FIFO operating profit rate in 2013, compared to 2012, was primarily due to improvements in OG&A
and rent expenses, as a percentage of sales, offset partially by continued investments in lower prices for our
customers and increased shrink and advertising costs, as a percentage of sales.
Interest Expense
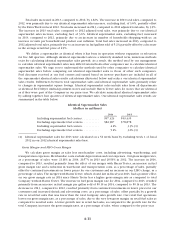
Interest expense totaled $488 million in 2014, $443 million in 2013 and $462 million in 2012. The
increase in interest expense in 2014, compared to 2013, resulted primarily from an increase in net total debt,
primarily due to financing the merger with Harris Teeter and repurchases of our outstanding common shares.
The decrease in interest expense in 2013, compared to 2012, resulted primarily from a lower weighted average
interest rate, offset partially by a decrease in the net benefit from interest rate swaps and the Extra Week.
Income Taxes
Our effective income tax rate was 34.1% in 2014, 32.9% in 2013 and 34.5% in 2012. The 2014 and 2013 tax
rates differed from the federal statutory rate primarily as a result of the utilization of tax credits, the Domestic
Manufacturing Deduction and other changes, partially offset by the effect of state income taxes. The 2013
benefit from the Domestic Manufacturing deduction was greater than 2014 and 2012 due to the amendment of
prior years’ tax returns to claim additional benefit available in years still under review by the Internal Revenue
Service. The 2012 tax rate differed from the federal statutory rate primarily as a result of the utilization of tax
credits, the favorable resolution of certain tax issues and other changes, partially offset by the effect of state
income taxes.
CO M M O N S H A R E R E P U R C H A S E P R O G R A M S
We maintain share repurchase programs that comply with Rule 10b5-1 of the Securities Exchange Act
of 1934 and allow for the orderly repurchase of our common shares, from time to time. We made open
market purchases of our common shares totaling $1.1 billion in 2014, $338 million in 2013 and $1.2 billion
in 2012 under these repurchase programs. In addition to these repurchase programs, we also repurchase
common shares to reduce dilution resulting from our employee stock option plans. This program is solely
funded by proceeds from stock option exercises, and the tax benefit from these exercises. We repurchased
approximately $155 million in 2014, $271 million in 2013 and $96 million in 2012 of our common shares
under the stock option program.