Kroger 2014 Annual Report Download - page 30
Download and view the complete annual report
Please find page 30 of the 2014 Kroger annual report below. You can navigate through the pages in the report by either clicking on the pages listed below, or by using the keyword search tool below to find specific information within the annual report.-
 1
1 -
2
-
3
-
4
-
5
-
6
-
7
-
8
-
9
-
10
-
11
-
12
-
13
-
14
-
15
-
16
-
17
-
18
-
19
-
 20
20 -
 21
21 -
 22
22 -
 23
23 -
 24
24 -
 25
25 -
 26
26 -
 27
27 -
 28
28 -
 29
29 -
 30
30 -
 31
31 -
 32
32 -
 33
33 -
 34
34 -
 35
35 -
 36
36 -
 37
37 -
 38
38 -
 39
39 -
 40
40 -
41
-
42
-
43
-
44
-
45
-
46
-
47
-
48
-
49
-
50
-
51
-
52
-
53
-
54
-
55
-
56
-
57
-
58
-
59
-
60
-
61
-
62
-
63
-
64
-
65
-
66
-
67
-
68
-
69
-
70
-
71
-
72
-
73
-
74
-
75
-
76
-
77
-
78
-
79
-
80
-
81
-
82
-
83
-
84
-
85
-
86
-
87
-
88
-
89
-
90
-
91
-
92
-
93
-
94
-
95
-
96
-
97
-
98
-
99
-
100
-
101
-
102
-
103
-
104
-
105
-
106
-
107
-
108
-
109
-
110
-
111
-
112
-
113
-
114
-
115
-
116
-
117
-
118
-
119
-
120
-
121
-
122
-
123
-
124
-
125
-
126
-
127
-
128
-
129
-
130
-
131
-
132
-
133
-
134
-
135
-
136
-
137
-
138
-
139
-
140
-
141
-
142
 |
 |
28
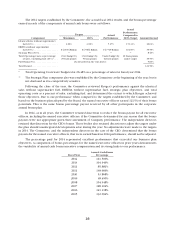
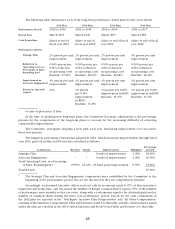
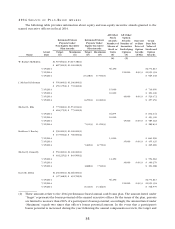
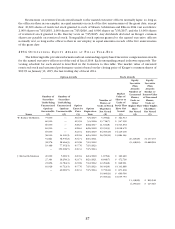
Thefollowingtablesummarizeseachofthelong-termperformancebasedplansfortheyearsshown:
2012 Plan 2013 Plan 2014 Plan 2015 Plan
Performance Period 2012to2014 2013to2015 2014to2016 2015to2017
Payout Date March2015 March2016 March2017 March2018
Cash Bonus Base Salaryatendof
fiscalyear2011*
Salaryatendof
fiscalyear2012*
Salaryatendoffiscal
year2013*
Salaryatendoffiscal
year2014*
Performance Metrics
Strategic Plan 2%payoutperunit
improvement
2%payoutperunit
improvement
2%payoutperunit
improvement
4%payoutperunit
improvement
Reduction in
Operating Cost as a
Percentage of Sales,
Excluding Fuel
0.50%payoutper
0.01%reduction
in operating costs
Baseline:27.09%
0.50%payoutper
0.01%reduction
in operating costs
Baseline:26.69%
0.50%payoutper
0.01%reduction
in operating costs
Baseline:26.68%
0.50%payoutper
0.01%reduction
in operating costs
Baseline:26.41%
Improvement in
Associate Engagement 4%payoutperunit
improvement
4%payoutperunit
improvement
4%payoutperunit
improvement
4%payoutperunit
improvement
Return on Invested
Capital N/A 1%payout
per0.01%
improvement
inROIC
Baseline:13.25%
1%payoutper0.01%
improvementinROIC
Baseline:13.27%
1%payoutper0.01%
improvementinROIC
Baseline:13.74%
* Ordateofplanentry,iflater.
Atthetimeofadoptingnewlong-termplans,theCommitteehasmadeadjustmentstothepercentage
payouts for the components of the long-term plans to account for the increasing difficulty of achieving
compounded improvement.
The Committee anticipates adopting a new plan each year, measuring improvement over successive
three-yearperiods.
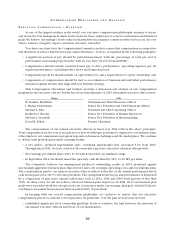
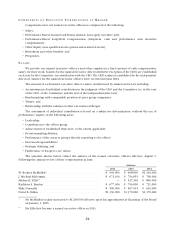
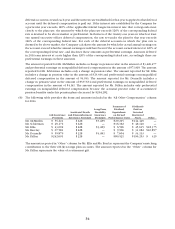
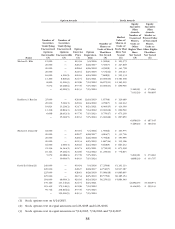
Thelong-termperformancebasedplanadoptedin2012,whichmeasuredimprovementsthroughfiscal
year2014,paidoutinMarch2015andwascalculatedasfollows:
Component Baseline Result Improvement Multiplier
Percentage
Earned
StrategicPlan . . . . . . . . . . . . . . . . . . . . . * * 9unitsofimprovement 2.00% 18.00%
AssociateEngagement . . . . . . . . . . . . . . * * 4unitsofimprovement 4.00% 16.00%
TotalOperatingCosts,asaPercentage
ofSales,ExcludingFuel . . . . . . . . . . 27.0 9 % 26.43% 66basispointimprovement 0.50% 33.00%
TotalEarned . . . . . . . . . . . . . . . . . . . . . . 67.00%
* The StrategicPlan andAssociateEngagement componentswereestablishedbythe Committeeatthe
beginningoftheperformanceperiod,butarenotdisclosedastheyarecompetitivelysensitive.
Accordingly,eachnamedexecutiveofficerreceivedcashinanamountequalto67%ofthatexecutive’s
long-termcashbonusbase,andwasissuedthenumberofKrogercommonsharesequalto67%ofthenumber
ofperformanceunitsawardedtothatexecutive,alongwithacashamountequaltothedividendspaidonthat
number of common shares during the three year performance period. Payout for the cash components of
the2012planarereportedinthe“Non-EquityIncentivePlanCompensation”and“AllOtherCompensation”
columnsoftheSummaryCompensationTableandfootnotes4and6tothattable,andthecommonsharesissued
undertheplanarereportedinthe2014OptionExercisesandStockVestedTableandfootnote2tothattable.