Kroger 2014 Annual Report Download - page 28
Download and view the complete annual report
Please find page 28 of the 2014 Kroger annual report below. You can navigate through the pages in the report by either clicking on the pages listed below, or by using the keyword search tool below to find specific information within the annual report.-
 1
1 -
2
-
3
-
4
-
5
-
6
-
7
-
8
-
9
-
10
-
11
-
12
-
13
-
14
-
15
-
16
-
17
-
 18
18 -
 19
19 -
 20
20 -
 21
21 -
 22
22 -
 23
23 -
 24
24 -
 25
25 -
 26
26 -
 27
27 -
 28
28 -
 29
29 -
 30
30 -
 31
31 -
 32
32 -
 33
33 -
 34
34 -
 35
35 -
 36
36 -
 37
37 -
 38
38 -
39
-
40
-
41
-
42
-
43
-
44
-
45
-
46
-
47
-
48
-
49
-
50
-
51
-
52
-
53
-
54
-
55
-
56
-
57
-
58
-
59
-
60
-
61
-
62
-
63
-
64
-
65
-
66
-
67
-
68
-
69
-
70
-
71
-
72
-
73
-
74
-
75
-
76
-
77
-
78
-
79
-
80
-
81
-
82
-
83
-
84
-
85
-
86
-
87
-
88
-
89
-
90
-
91
-
92
-
93
-
94
-
95
-
96
-
97
-
98
-
99
-
100
-
101
-
102
-
103
-
104
-
105
-
106
-
107
-
108
-
109
-
110
-
111
-
112
-
113
-
114
-
115
-
116
-
117
-
118
-
119
-
120
-
121
-
122
-
123
-
124
-
125
-
126
-
127
-
128
-
129
-
130
-
131
-
132
-
133
-
134
-
135
-
136
-
137
-
138
-
139
-
140
-
141
-
142
 |
 |

26
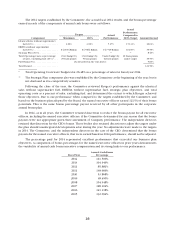
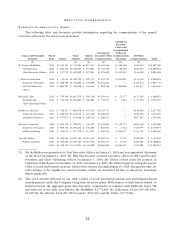
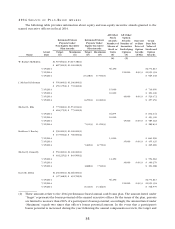
The2014targetsestablishedbytheCommittee,theactualfiscal2014results,andthebonuspercentage
earnedineachofthecomponentsofannualcashbonuswereasfollows:
Targets Actual
Performance
Actual
Performance
Compared to
100% Target Amount EarnedComponent Minimum 100%
IdenticalSaleswithoutsupermarket
fuel(30%) . . . . . . . . . . . . . . . . . . . 1.00% 3.00% 5.17% 172.33% 49.01%
EBITDAwithoutsupermarket
fuel(30%) . . . . . . . . . . . . . . . . . . . $4.0004Billion $4.7064Billion $4.7719Billion 101.39% 39.59%
StrategicPlan(30%). . . . . . . . . . . . . . . ** ** ** ** 8.40%
TotalOperatingCostsaspercentage
ofsales,excludingfuel(10%)* . . .
Overbudgetby
25basispoints
Overbudgetby
5basispoints
Underbudgetby
14basispoints
19basispoints
under target 19.50%
FuelBonus(5%) . . . . . . . . . . . . . . . . . . [Asdescribedinthetextabove] 5.00%
TotalEarned. . . . . . . . . . . . . . . . . . . . . 121.50%
* TotalOperatingCostswerebudgetedat26.48%asapercentageofsalesforfiscalyear2014.
** TheStrategicPlancomponentalsowasestablishedbytheCommitteeatthebeginningoftheyear,butis
not disclosed as it is competitively sensitive.
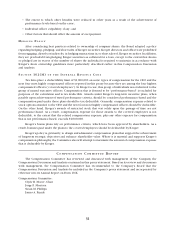
Followingthe closeofthe year,the CommitteereviewedKroger’s performance against the identical
sales without supermarket fuel, EBITDA without supermarket fuel, strategic plan objectives, and total
operatingcostsasapercentofsales,excludingfuel,anddeterminedtheextenttowhichKrogerachieved
thoseobjectives.DuetoourperformancewhencomparedtothetargetsestablishedbytheCommittee,and
basedonthebusinessplanadoptedbytheBoard,thenamedexecutiveofficersearned121.5%oftheirbonus
potentials. This is the same bonus percentage payout received by all other participants in the corporate
annualbonusplan.
In2014,asinallyears,theCommitteeretaineddiscretiontoreducethebonuspayoutforallexecutive
officers,includingthenamedexecutiveofficers,iftheCommitteedeterminedforanyreasonthatthebonus
payoutswerenotappropriategiventheirassessmentofCompanyperformance.Theindependentdirectors
retainedthatdiscretionfortheCEO’sbonus.Thosebodiesalsoretaineddiscretiontoadjustthetargetsunder
theplanshouldunanticipateddevelopmentsariseduringtheyear.Noadjustmentsweremadetothetargets
in2014.TheCommittee,andtheindependentdirectorsinthecaseoftheCEO,determinedthatthebonus
payoutsforthenamedexecutiveofficers,thatwereearnedbasedon2014performance,shouldnotbeadjusted.
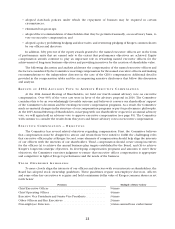
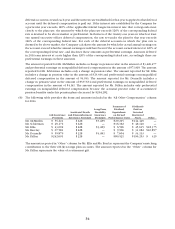
The percentage paid for 2014 represented excellent performance that exceeded our business plan
objectives.Acomparisonofbonuspercentagesforthenamedexecutiveofficersinprioryearsdemonstrates
thevariabilityofannualcashbonusincentivecompensationanditsstronglinkstoourperformance:
Fiscal Year
Annual Cash Bonus
Percentage
2014 121.500%
2013 104.949%
2012 85.881%
2011 138.666%
2010 53.868%
2009 38.450%
2008 104.948%
2007 128.104%
2006 141.118%
2005 132.094%