Intel 1999 Annual Report Download - page 43
Download and view the complete annual report
Please find page 43 of the 1999 Intel annual report below. You can navigate through the pages in the report by either clicking on the pages listed below, or by using the keyword search tool below to find specific information within the annual report.-
 1
1 -
2
-
3
-
4
-
5
-
6
-
7
-
8
-
9
-
10
-
11
-
12
-
13
-
14
-
15
-
16
-
17
-
18
-
19
-
20
-
21
-
22
-
23
-
24
-
25
-
26
-
27
-
28
-
29
-
30
-
31
-
32
-
 33
33 -
 34
34 -
 35
35 -
 36
36 -
 37
37 -
 38
38 -
 39
39 -
 40
40 -
 41
41 -
 42
42 -
 43
43 -
 44
44 -
 45
45 -
 46
46 -
 47
47 -
 48
48 -
 49
49 -
 50
50 -
 51
51 -
 52
52 -
 53
53 -
54
-
55
-
56
-
57
-
58
-
59
-
60
-
61
-
62
-
63
-
64
-
65
-
66
-
67
 |
 |
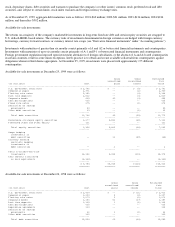
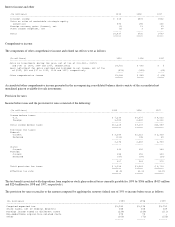
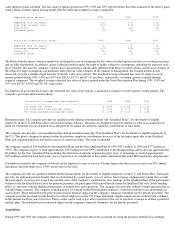
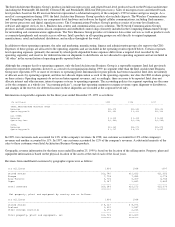
Interest income and other
Comprehensive income
The components of other comprehensive income and related tax effects were as follows:
Accumulated other comprehensive income presented in the accompanying consolidated balance sheets consists of the accumulated net
unrealized gain on available-for-sale investments.
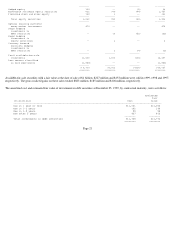
Provision for taxes
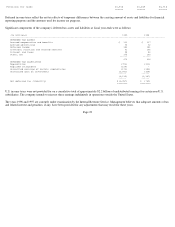
Income before taxes and the provision for taxes consisted of the following:
The tax benefit associated with dispositions from employee stock plans reduced taxes currently payable for 1999 by $506 million ($415 million
and $224 million for 1998 and 1997, respectively).
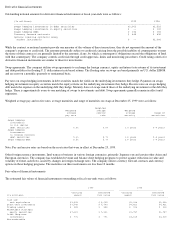
The provision for taxes reconciles to the amount computed by applying the statutory federal rate of 35% to income before taxes as follows:
(In millions) 1999 1998 1997
------------------------------------------------------------------------------------------------------------------------
Interest income $ 618 $593 $562
Gains on sales of marketable strategic equity
securities 883 185 106
Foreign currency gains (losses), net (1) 11 63
Other income (expense), net (3) 3 68
------ ----- -----
Total $1,497 $792 $799
====== ===== =====
(In millions) 1999 1998 1997
-------------------------------------------------------------------------------------------------------------------------
Gains on investments during the year, net of tax of $(2,026), $(357)
and $(4) in 1999, 1998 and 1997, respectively $3,762 $ 665 $ 5
Less: adjustment for gains realized and included in net income, net of tax
of $309, $65 and $37 in 1999, 1998 and 1997, respectively (574) (120) (69)
----- ----- -----
Other comprehensive income $3,188 $ 545 $ (64)
====== ===== =====
(In millions) 1999 1998 1997
-----------------------------------------------------------------------------------------------------------------------
Income before taxes:
U.S. $ 7,239 $6,677 $ 8,033
Foreign 3,989 2,460 2,626
------- ------ -------
Total income before taxes $11,228 $9,137 $10,659
======= ====== =======
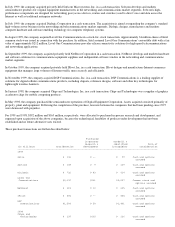
Provision for taxes:
Federal:
Current $ 3,356 $2,321 $ 2,930
Deferred (162) 145 30
------- ------ -------
3,194 2,466 2,960
------- ------ -------
State:
Current 393 320 384
Foreign:
Current 384 351 394
Deferred (57) (68) (24)
-------- ------- --------
327 283 370
-------- ------- --------
Total provision for taxes $ 3,914 $3,069 $ 3,714
======= ====== =======
Effective tax rate 34.9% 33.6% 34.8%
======= ====== =======
(In millions) 1999 1998 1997
----------------------------------------------------------------------------------------------------------------------
Computed expected tax $3,930 $3,198 $3,731
State taxes, net of federal benefits 255 208 249
Foreign income taxed at different rates (239) (339) (111)
Non-deductible acquisition-related costs 274 74 -
Other (306) (72) (155)
------ ------ ------