Intel 1999 Annual Report Download - page 40
Download and view the complete annual report
Please find page 40 of the 1999 Intel annual report below. You can navigate through the pages in the report by either clicking on the pages listed below, or by using the keyword search tool below to find specific information within the annual report.-
 1
1 -
2
-
3
-
4
-
5
-
6
-
7
-
8
-
9
-
10
-
11
-
12
-
13
-
14
-
15
-
16
-
17
-
18
-
19
-
20
-
21
-
22
-
23
-
24
-
25
-
26
-
27
-
28
-
29
-
 30
30 -
 31
31 -
 32
32 -
 33
33 -
 34
34 -
 35
35 -
 36
36 -
 37
37 -
 38
38 -
 39
39 -
 40
40 -
 41
41 -
 42
42 -
 43
43 -
 44
44 -
 45
45 -
 46
46 -
 47
47 -
 48
48 -
 49
49 -
 50
50 -
51
-
52
-
53
-
54
-
55
-
56
-
57
-
58
-
59
-
60
-
61
-
62
-
63
-
64
-
65
-
66
-
67
 |
 |
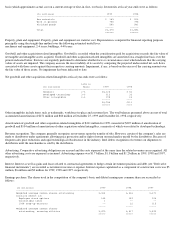
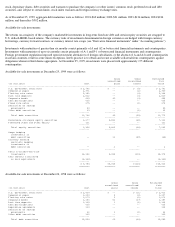
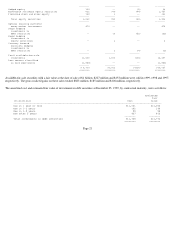
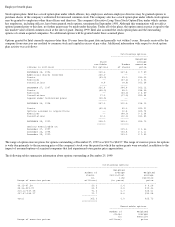
Available-for-sale securities with a fair value at the date of sale of $1 billion, $227 million and $153 million were sold in 1999, 1998 and 1997,
respectively. The gross realized gains on these sales totaled $883 million, $185 million and $106 million, respectively.
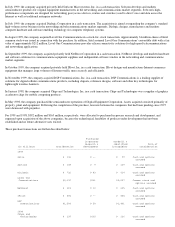
The amortized cost and estimated fair value of investments in debt securities at December 25, 1999, by contractual maturity, were as follows:
Page 21
-------- -------- -------- --------
Hedged equity 100 -- (2) 98
Marketable strategic equity securities 822 979 (44) 1,757
Preferred stock and other equity 140 1 -- 141
-------- -------- -------- --------
Total equity securities 1,062 980 (46) 1,996
-------- -------- -------- --------
Options creating synthetic
money market instruments 474 -- -- 474
Swaps hedging
investments in
debt securities -- 19 (52) (33)
Swaps hedging
investments in
equity securities -- 2 -- 2
Currency forward
contracts hedging
investments in
debt securities -- 2 (4) (2)
-------- -------- -------- --------
Total available-for-sale
investments 11,560 1,063 (136) 12,487
Less amounts classified
as cash equivalents (1,850) -- -- (1,850)
-------- -------- -------- --------
$ 9,710 $1,063 $(136) $10,637
======== ======== ======== ========
Estimated
fair
(In millions) Cost value
------------------------------------------------------------------------------------------------------------
Due in 1 year or less $11,031 $11,054
Due in 1-2 years 192 194
Due in 2-5 years 58 58
Due after 5 years 467 466
-------- --------
Total investments in debt securities $11,748 $11,772
======== ========