Intel 1999 Annual Report Download - page 28
Download and view the complete annual report
Please find page 28 of the 1999 Intel annual report below. You can navigate through the pages in the report by either clicking on the pages listed below, or by using the keyword search tool below to find specific information within the annual report.-
 1
1 -
2
-
3
-
4
-
5
-
6
-
7
-
8
-
9
-
10
-
11
-
12
-
13
-
14
-
15
-
16
-
17
-
 18
18 -
 19
19 -
 20
20 -
 21
21 -
 22
22 -
 23
23 -
 24
24 -
 25
25 -
 26
26 -
 27
27 -
 28
28 -
 29
29 -
 30
30 -
 31
31 -
 32
32 -
 33
33 -
 34
34 -
 35
35 -
 36
36 -
 37
37 -
 38
38 -
39
-
40
-
41
-
42
-
43
-
44
-
45
-
46
-
47
-
48
-
49
-
50
-
51
-
52
-
53
-
54
-
55
-
56
-
57
-
58
-
59
-
60
-
61
-
62
-
63
-
64
-
65
-
66
-
67
 |
 |
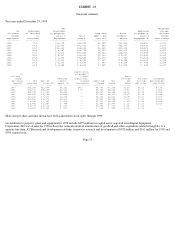
EXHIBIT - 13
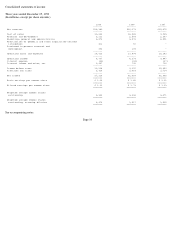
Financial summary
Ten years ended December 25, 1999
Share and per share amounts shown have been adjusted for stock splits through 1999.
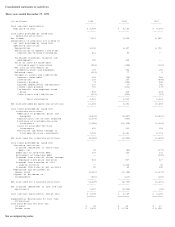
/A/ Additions to property, plant and equipment in 1998 include $475 million for capital assets acquired from Digital Equipment
Corporation. /B/ Cost of sales for 1998 reflects the reclassification of amortization of goodwill and other acquisition-related intangibles to a
separate line item. /C/ Research and development excludes in-
process research and development of $392 million and $165 million for 1999 and
1998, respectively.
Page 13
Net Weighted
(In Employees investment Additions average
millions- at Year-end in property, Long-term Stock- to property, diluted
except (in plant & Total debt & put holders' plant & shares
employees) thousands) equipment assets warrants equity equipment/A/ outstanding
---------- ----------- ------------- -------- ---------- -------- ------------ -----------
1999 70.2 $11,715 $43,849 $1,085 $32,535 $3,403 3,470
1998 64.5 $11,609 $31,471 $ 903 $23,377 $4,032 3,517
1997 63.7 $10,666 $28,880 $2,489 $19,295 $4,501 3,590
1996 48.5 $ 8,487 $23,735 $1,003 $16,872 $3,024 3,551
1995 41.6 $ 7,471 $17,504 $1,125 $12,140 $3,550 3,536
1994 32.6 $ 5,367 $13,816 $1,136 $ 9,267 $2,441 3,496
1993 29.5 $ 3,996 $11,344 $1,114 $ 7,500 $1,933 3,528
1992 25.8 $ 2,816 $ 8,089 $ 622 $ 5,445 $1,228 3,436
1991 24.6 $ 2,163 $ 6,292 $ 503 $ 4,418 $ 948 3,344
1990 23.9 $ 1,658 $ 5,376 $ 345 $ 3,592 $ 680 3,247
Amortization
In of goodwill
millions - & other Basic
except Research acquisition- earnings Diluted Dividends
per share Net Cost of & devel- related Operating Net per earnings declared per
amounts) revenues sales /B/ opment /C/ intangibles income income share per share per share
---------- -------- ---------- ---------- ------------ --------- ------ -------- --------- ------------
1999 $29,389 $11,836 $3,111 $411 $9,767 $7,314 $2.20 $2.11 $.110
1998 $26,273 $12,088 $2,509 $ 56 $8,379 $6,068 $1.82 $1.73 $.050
1997 $25,070 $ 9,945 $2,347 -- $9,887 $6,945 $2.12 $1.93 $.058
1996 $20,847 $ 9,164 $1,808 -- $7,553 $5,157 $1.57 $1.45 $.048
1995 $16,202 $ 7,811 $1,296 -- $5,252 $3,566 $1.08 $1.01 $.038
1994 $11,521 $ 5,576 $1,111 -- $3,387 $2,288 $ .69 $ .65 $.029
1993 $ 8,782 $ 3,252 $ 970 -- $3,392 $2,295 $ .69 $ .65 $.025
1992 $ 5,844 $ 2,557 $ 780 -- $1,490 $1,067 $ .32 $ .31 $.013
1991 $ 4,779 $ 2,316 $ 618 -- $1,080 $ 819 $ .25 $ .24 --
1990 $ 3,921 $ 1,930 $ 517 -- $ 858 $ 650 $ .21 $ .20 --