Intel 1999 Annual Report Download - page 41
Download and view the complete annual report
Please find page 41 of the 1999 Intel annual report below. You can navigate through the pages in the report by either clicking on the pages listed below, or by using the keyword search tool below to find specific information within the annual report.-
 1
1 -
2
-
3
-
4
-
5
-
6
-
7
-
8
-
9
-
10
-
11
-
12
-
13
-
14
-
15
-
16
-
17
-
18
-
19
-
20
-
21
-
22
-
23
-
24
-
25
-
26
-
27
-
28
-
29
-
30
-
 31
31 -
 32
32 -
 33
33 -
 34
34 -
 35
35 -
 36
36 -
 37
37 -
 38
38 -
 39
39 -
 40
40 -
 41
41 -
 42
42 -
 43
43 -
 44
44 -
 45
45 -
 46
46 -
 47
47 -
 48
48 -
 49
49 -
 50
50 -
 51
51 -
52
-
53
-
54
-
55
-
56
-
57
-
58
-
59
-
60
-
61
-
62
-
63
-
64
-
65
-
66
-
67
 |
 |
Derivative financial instruments
Outstanding notional amounts for derivative financial instruments at fiscal year-ends were as follows:
While the contract or notional amounts provide one measure of the volume of these transactions, they do not represent the amount of the
company's exposure to credit risk. The amounts potentially subject to credit risk (arising from the possible inability of counterparties to meet
the terms of their contracts) are generally limited to the amounts, if any, by which a counterparty's obligations exceed the obligations of Intel
with that counterparty. The company controls credit risk through credit approvals, limits and monitoring procedures. Credit rating criteria for
derivative financial instruments are similar to those for investments.
Swap agreements. The company utilizes swap agreements to exchange the foreign currency, equity and interest rate returns of its investment
and debt portfolios for floating U.S. dollar interest rate based returns. The floating rates on swaps are based primarily on U.S. dollar LIBOR
and are reset on a monthly, quarterly or semiannual basis.
Pay rates on swaps hedging investments in debt securities match the yields on the underlying investments they hedge. Payments on swaps
hedging investments in equity securities match the equity returns on the underlying investments they hedge. Receive rates on swaps hedging
debt match the expense on the underlying debt they hedge. Maturity dates of swaps match those of the underlying investment or the debt they
hedge. There is approximately a one-to-one matching of swaps to investments and debt. Swap agreements generally remain in effect until
expiration.
Weighted average pay and receive rates, average maturities and range of maturities on swaps at December 25, 1999 were as follows:
Note: Pay and receive rates are based on the reset rates that were in effect at December 25, 1999.
Other foreign currency instruments. Intel transacts business in various foreign currencies, primarily Japanese yen and certain other Asian and
European currencies. The company has established revenue and balance sheet hedging programs to protect against reductions in value and
volatility of future cash flows caused by changes in foreign exchange rates. The company utilizes currency forward contracts and currency
options in these hedging programs. The maturities on these instruments are less than 12 months.
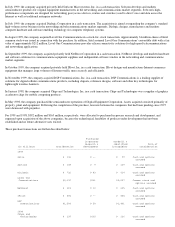
Fair values of financial instruments
The estimated fair values of financial instruments outstanding at fiscal year-ends were as follows:
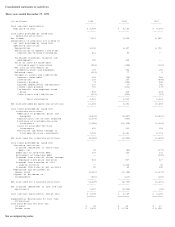
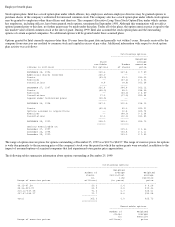
(In millions) 1999 1998
-----------------------------------------------------------------------------------------------------------
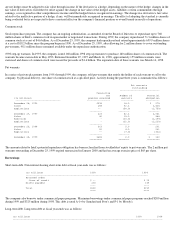
Swaps hedging investments in debt securities $2,002 $2,526
Swaps hedging investments in equity securities $ -- $ 100
Swaps hedging debt $ 156 $ 156
Currency forward contracts $ 845 $ 830
Options creating synthetic money
market instruments $ -- $2,086
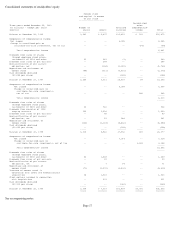
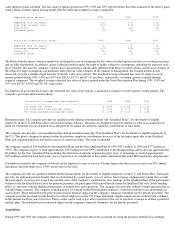
Weighted
Weighted average Weighted
average receive average Range of
pay rate rate maturity maturities
----------------------------------------------------------------------------------------------------------------------------
Swaps hedging
investments
in U.S. dollar
debt securities 6.0% 6.0% 1.0 years 0-4 years
Swaps hedging
investments
in foreign currency
debt securities 5.6% 5.7% 1.6 years 0-4 years
Swaps hedging debt 5.5% 5.7% 3.8 years 1-4 years
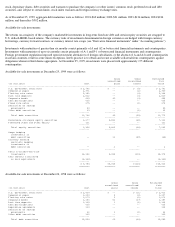
1999 1998
---------------------------------- ----------------------------------
Carrying Estimated Carrying Estimated
(In millions) amount fair value amount fair value
-----------------------------------------------------------------------------------------------------------------------------
Cash and
cash equivalents $3,695 $ 3,695 $2,038 $2,038
Short-term investments $7,740 $ 7,740 $4,821 $4,821
Trading assets $ 388 $ 388 $ 316 $ 316
Marketable strategic
equity securities $7,121 $ 7,121 $1,757 $1,757
Other long-term
investments $ 791 $ 791 $3,618 $3,618
Non-marketable