INTL FCStone 2012 Annual Report Download - page 3
Download and view the complete annual report
Please find page 3 of the 2012 INTL FCStone annual report below. You can navigate through the pages in the report by either clicking on the pages listed below, or by using the keyword search tool below to find specific information within the annual report.-
 1
1 -
 2
2 -
 3
3 -
 4
4 -
 5
5 -
 6
6 -
 7
7 -
 8
8 -
 9
9 -
 10
10 -
 11
11 -
 12
12 -
 13
13 -
 14
14 -
15
-
16
-
17
-
18
-
19
-
20
-
21
-
22
-
23
-
24
-
25
-
26
-
27
-
28
-
29
-
30
-
31
-
32
-
33
-
34
-
35
-
36
-
37
-
38
-
39
-
40
-
41
-
42
-
43
-
44
-
45
-
46
-
47
-
48
-
49
-
50
-
51
-
52
-
53
-
54
-
55
-
56
-
57
-
58
-
59
-
60
-
61
-
62
-
63
-
64
-
65
-
66
-
67
-
68
-
69
-
70
-
71
-
72
-
73
-
74
-
75
-
76
-
77
-
78
-
79
-
80
-
81
-
82
-
83
-
84
-
85
-
86
-
87
-
88
-
89
-
90
-
91
-
92
-
93
-
94
-
95
-
96
-
97
-
98
-
99
-
100
-
101
-
102
-
103
-
104
-
105
-
106
-
107
-
108
-
109
-
110
-
111
-
112
-
113
-
114
-
115
-
116
-
117
-
118
-
119
-
120
-
121
-
122
-
123
-
124
-
125
-
126
-
127
-
128
-
129
-
130
-
131
-
132
-
133
-
134
-
135
-
136
-
137
-
138
-
139
-
140
-
141
-
142
-
143
-
144
 |
 |

1983 1994 2000 2004 2007 2007
Farmers Commodities Corporation
(FCC) became a clearing member
of the Kansas City Board of Trade in
1983 and in 1985 purchased its rst
seat on the Chicago Board of Trade.
International
Assets was listed
on NASDAQ.
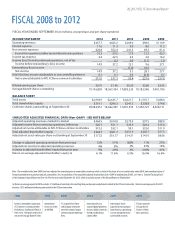
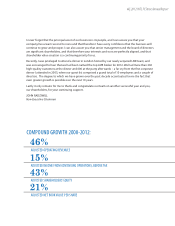
FISCAL 2008 to 2012
Note: The unaudited data (non-GAAP) has been adjusted for unrealized gains in commodities inventory, which is stated at the lower of cost or market value under GAAP, and unrealized values of
forward commitments to purchase and sell commodities. For a reconciliation of the unaudited adjusted nancial data (non-GAAP) to audited data (GAAP), see “Item 6. Selected Financial Data”
in the Company’s Annual Report on Form 10-K for the year ended September 30, 2012, which is included as part of this Annual Report to Shareholders.
(a) Return on average equity for 2010 excludes $7.0 million extraordinary loss resulting from purchase price adjustments related to the FCStone transaction. Return on average equity for 2009
excludes $18.5 million extraordinary gain related to the FCStone transaction.
FCC acquired Saul Stone
and Company to become
one of the nation’s largest
commercial grain brokerage
rms.
International Assets
acquired global payments
business Global Currencies,
thereby establishing a
London oce.
International Assets
acquired Gainvest group in
South America, specializing
in asset management and
asset backed securities.
FCStone acquired
Chicago-based
Downes-O’Neill,
dairy specialists.
FISCAL YEAR ENDED SEPTEMBER 30
(in millions, except share and per share numbers)
INCOME STATEMENT 2012 2011 2010 2009 2008
Operating revenues
Interest expense
Non-interest expenses
Income from operations, before tax and discontinued operations
Income tax expense
Income (loss) from discontinued operations, net of tax
Income before extraordinary (loss) income
Extraordinary (loss) income
Net income
Add: Net (loss) income attributable to noncontrolling interests
Net income attributable to INTL FCStone common stockholders
Diluted earnings per share
Average diluted shares outstanding
BALANCE SHEET
Total assets
Total shareholders’ equity
Common shares outstanding at September 30
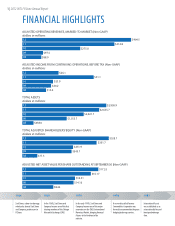
UNAUDITED ADJUSTED FINANCIAL DATA (Non-GAAP) - SEE NOTE BELOW
Adjusted operating revenues, marked-to-market
Adjusted income from continuing operations, before tax
Adjusted net income attributable to INTL FCStone common stockholders
Total adjusted shareholders’ equity
Adjusted net asset value per share outstanding at September 30
Change in adjusted operating revenues from prior year
Adjusted net income to adjusted operating revenues
Increase in adjusted shareholders’ equity from prior year
Return on average adjusted shareholders’ equity (a)
$457.7
11.6
426.8
19.3
4.4
-
14.9
-
14.9
0.1
$15.0
$0.75
19,156,899
$2,958.9
$319.1
18,984,951
$464.5
$26.1
$19.2
$328.7
$17.32
12%
4%
9%
6.1%
2 | 2012 INTL FCStone Annual Report
$114.9
11.2
61.4
42.3
16.2
1.0
27.1
-
27.1
0.7
$27.8
$2.95
9,901,706
$438.0
$74.8
8,928,711
$90.6
8.0
69.3
13.3
2.6
(1.1)
9.6
18.5
28.1
(0.5)
$27.6
$2.80
10,182,586
$1,555.7
$238.8
17,350,727
$269.0
9.9
241.2
17.9
6.4
0.6
12.1
(7.0)
5.1
0.3
$5.4
$0.30
17,883,233
$2,021.7
$241.3
17,601,535
$88.0
$15.4
$11.0
$77.3
$8.66
27%
13%
41%
16.6%
$97.5
$20.2
$32.0
$245.7
$14.16
11%
33%
218%
16.0%
$275.0
$23.9
$9.1
$251.9
$14.31
182%
3%
3%
6.5%
$423.2
11.3
352.4
59.5
22.5
0.2
37.2
-
37.2
0.1
$37.3
$1.96
18,567,454
$2,635.7
$296.3
18,642,407
$414.8
$51.1
$32.1
$301.7
$16.17
51%
8%
20%
11.6%