INTL FCStone 2012 Annual Report Download - page 2
Download and view the complete annual report
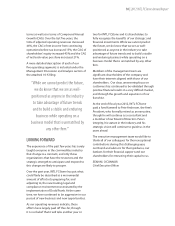
Please find page 2 of the 2012 INTL FCStone annual report below. You can navigate through the pages in the report by either clicking on the pages listed below, or by using the keyword search tool below to find specific information within the annual report.-
 1
1 -
 2
2 -
 3
3 -
 4
4 -
 5
5 -
 6
6 -
 7
7 -
 8
8 -
 9
9 -
 10
10 -
 11
11 -
 12
12 -
 13
13 -
14
-
15
-
16
-
17
-
18
-
19
-
20
-
21
-
22
-
23
-
24
-
25
-
26
-
27
-
28
-
29
-
30
-
31
-
32
-
33
-
34
-
35
-
36
-
37
-
38
-
39
-
40
-
41
-
42
-
43
-
44
-
45
-
46
-
47
-
48
-
49
-
50
-
51
-
52
-
53
-
54
-
55
-
56
-
57
-
58
-
59
-
60
-
61
-
62
-
63
-
64
-
65
-
66
-
67
-
68
-
69
-
70
-
71
-
72
-
73
-
74
-
75
-
76
-
77
-
78
-
79
-
80
-
81
-
82
-
83
-
84
-
85
-
86
-
87
-
88
-
89
-
90
-
91
-
92
-
93
-
94
-
95
-
96
-
97
-
98
-
99
-
100
-
101
-
102
-
103
-
104
-
105
-
106
-
107
-
108
-
109
-
110
-
111
-
112
-
113
-
114
-
115
-
116
-
117
-
118
-
119
-
120
-
121
-
122
-
123
-
124
-
125
-
126
-
127
-
128
-
129
-
130
-
131
-
132
-
133
-
134
-
135
-
136
-
137
-
138
-
139
-
140
-
141
-
142
-
143
-
144
 |
 |

1924 1930 1978 1981
Saul Stone, a door-to-door egg
wholesaler, formed Saul Stone
and Company, predecessor to
FCStone.
In the 1930’s, Saul Stone and
Company became one of the rst
clearing members of the Chicago
Mercantile Exchange (CME).
A new entity called Farmers
Commodities Corporation was
formed to accommodate the grain
hedging brokerage services.
International Assets
was established as an
internationally focused
boutique brokerage
rm.
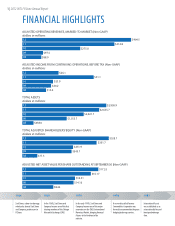
FINANCIAL HIGHLIGHTS
1970
In the early 1970’s, Saul Stone and
Company became one of the major
innovators on the CME’s International
Monetary Market, bringing nancial
futures to the forefront of the
industry.
TOTAL ADJUSTED SHAREHOLDERS’ EQUITY (Non-GAAP)
dollars in millions
10 $251.9
09 $245.7
08 $77.3
11 $301.7
12 $328.7
ADJUSTED NET ASSET VALUE PER SHARE OUTSTANDING AT SEPTEMBER 30 (Non-GAAP)
10 $14.31
09 $14.16
08 $8.66
11 $16.17
12 $17.32
TOTAL ASSETS
dollars in millions
10 $2,021.7
09 $1,555.7
08 $438.0
11 $2,635.7
12 $2,958.9
ADJUSTED INCOME FROM CONTINUING OPERATIONS, BEFORE TAX (Non-GAAP)
dollars in millions
10 $23.9
09 $20.2
08 $15.4
11 $51.1
12 $26.1
ADJUSTED OPERATING REVENUES, MARKED-TO-MARKET (Non-GAAP)
dollars in millions
10 $275.0
09 $97.5
08 $88.0
11 $414.8
12 $464.5
1 | 2012 INTL FCStone Annual Report