Hyundai 2009 Annual Report Download - page 67
Download and view the complete annual report
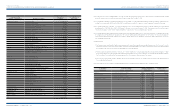
Please find page 67 of the 2009 Hyundai annual report below. You can navigate through the pages in the report by either clicking on the pages listed below, or by using the keyword search tool below to find specific information within the annual report.-
 1
1 -
2
-
3
-
4
-
5
-
6
-
7
-
8
-
9
-
10
-
11
-
12
-
13
-
14
-
15
-
16
-
17
-
18
-
19
-
20
-
21
-
22
-
23
-
24
-
25
-
26
-
27
-
28
-
29
-
30
-
31
-
32
-
33
-
34
-
35
-
36
-
37
-
38
-
39
-
40
-
41
-
42
-
43
-
44
-
45
-
46
-
47
-
48
-
49
-
50
-
51
-
52
-
53
-
54
-
55
-
56
-
 57
57 -
 58
58 -
 59
59 -
 60
60 -
 61
61 -
 62
62 -
 63
63 -
 64
64 -
 65
65 -
 66
66 -
 67
67 -
 68
68 -
 69
69 -
 70
70 -
 71
71 -
 72
72 -
 73
73
 |
 |

HYUNDAI MOTOR COMPANY I 2010 ANNUAL REPORT I 133HYUNDAI MOTOR COMPANY I 2010 ANNUAL REPORT I 132
HYUNDAI MOTOR COMPANY
>>
NOTES TO CONSOLIDATED FINANCIAL STATEMENTS FOR THE YEARS ENDED DECEMBER 31, 2009 AND 2008
HYUNDAI MOTOR COMPANY
>>
NOTES TO CONSOLIDATED FINANCIAL STATEMENTS FOR THE YEARS ENDED DECEMBER 31, 2009 AND 2008
(
2
)
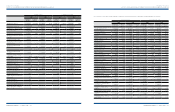
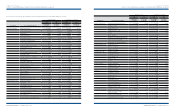
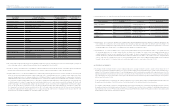
The transactions of derivatives belonging to subsidiaries as of December 31, 2009 consist of the following:
Derivatives
Korean Won
in millions
U.S. Dollars (Note 2)
in thousands
Korean Won
in millions
U.S. Dollars (Note 2)
in thousands
Currency option ₩ (18,870) $ (16,161) ₩ - $ -
Currency forward 13,580 11,631 3,113 2,666
Forward exchange 1,959 1,678 - -
Currency swap (382,947) (327,978) 42,298 36,226
Interest rate swap (46,923) (40,188) (14,875) (12,740)
Others - - (59,129) (50,641)
Total ₩ (433,201) $ (371,018) ₩ (28,593) $ (24,489)
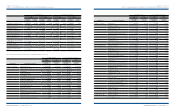
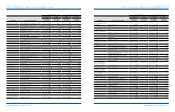
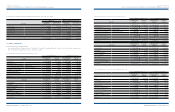
30. SEGMENT INFORMATION:
(1) Consolidated financial statements by industry
The consolidated statements of financial position as of December 31, 2009 and 2008, consolidated statements of income for the years then ended, by industry under
which the Company and its subsidiaries’ business are classified, are as follows:
Consolidated Statement of Financial Position as of December 31, 2009
Gain (loss) Other comprehensive gain (loss)
ASSETS Non-financial
industry Financial
industry Non-financial
industry Financial
industry
Current assets: ₩ 33,769,845 ₩ 3,016,532 $ 28,922,444 $ 2,583,532
Non-current assets: 37,887,197 1,935,685 32,448,781 1,657,833
Investments, net of unamortized present value discount 4,557,037 182,681 3,902,909 156,459
Property, plant and equipment, net of accumulated depreciation 28,425,050 396,187 24,344,853 339,317
Intangibles, net of amortization 3,667,316 40,871 3,140,901 35,004
Other non-current assets 1,237,794 1,315,946 1,060,118 1,127,053
Other financial business assets - 25,715,675 - 22,024,387
Total assets ₩ 71,657,042 ₩ 30,667,892 $ 61,371,225 $ 26,265,752
LIABILITIES Non-financial
industry Financial
industry Non-financial
industry Financial
industry
Current liabilities ₩ 32,314,135 ₩ 10,940,640 $ 27,675,689 $ 9,370,196
Borrowings 13,158,032 9,580,036 11,269,298 8,204,896
Other current liabilities 19,156,103 1,360,604 16,406,391 1,165,300
Non-current liabilities 15,168,170 14,740,665 12,990,896 12,624,755
Borrowings 9,822,869 13,427,560 8,412,872 11,500,137
Other non-current liabilities 5,345,301 1,313,105 4,578,024 1,124,618
Other financial business liabilities - 199,664 - 171,005
Total liabilities ₩ 47,482,305 ₩ 25,880,969 $ 40,666,585 $ 22,165,956
Korean Won in millions U.S. Dollars (Note 2) in thousands
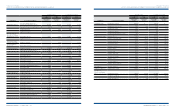
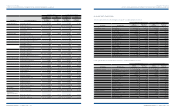
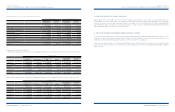
Consolidated Statements of Financial Position as of December 31, 2008
Non-financial
industry
Financial
industry
Non-financial
industry
Financial
industry
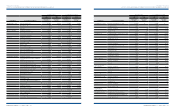
Sales ₩ 86,421,828 ₩ 5,041,236 $ 74,016,640 $ 4,317,605
Cost of sales 68,187,590 2,867,486 58,399,787 2,455,880
Selling and administrative expenses 13,459,439 1,328,308 11,527,440 1,137,639
Operating income 4,774,799 845,442 4,089,414 724,086
Other income (expenses), net (91,191) 28,722 (78,101) 24,599
Income before income tax 4,683,608 874,164 4,011,313 748,685
Income tax expense 1,300,065 217,211 1,113,450 186,033
Changes in consolidation scope (2,487) 5,427 (2,130) 4,648
Net income ₩ 3,381,056 ₩ 662,380 $ 2,895,732 $ 567,300
Consolidated Statements of Income for the year ended December 31, 2009
Korean Won in millions U.S. Dollars (Note 2) in thousands
ASSETS
Non-nancial
industry
Financial
industry
Non-nancial
industry
Financial
industry
Current assets: ₩ 36,149,951 ₩ 2,624,437 $ 30,960,904 $ 2,247,719
Non-current assets: 37,478,317 2,754,699 32,098,593 2,359,283
Investments, net of unamortized present value discount 3,908,195 182,703 3,347,204 156,477
Property, plant and equipment, net of accumulated depreciation 28,537,629 380,632 24,441,272 325,995
Intangibles, net of amortization 3,391,825 57,032 2,904,955 48,845
Other non-current assets 1,640,668 2,134,332 1,405,162 1,827,966
Other financial business assets - 24,198,379 - 20,724,888
Total assets ₩ 73,628,268 ₩ 29,577,515 $ 63,059,497 $ 25,331,890
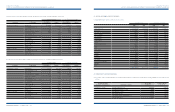
LIABILITIES
Non-nancial
industry
Financial
industry
Non-nancial
industry
Financial
industry
Current liabilities ₩ 36,592,696 ₩ 11,353,374 $ 31,340,096 $ 9,723,684
Borrowings 18,213,857 9,832,611 15,599,398 8,421,215
Other current liabilities 18,378,839 1,520,763 15,740,698 1,302,469
Non-current liabilities 14,843,325 14,300,673 12,712,680 12,247,922
Borrowings 9,006,897 13,231,014 7,714,026 11,331,804
Other non-current liabilities 5,836,428 1,069,659 4,998,654 916,118
Other financial business liabilities - 763,818 - 654,178
Total liabilities ₩ 51,436,021 ₩ 26,417,865 $ 44,052,776 $ 22,625,784
Korean Won in millions U.S. Dollars (Note 2) in thousands