Hyundai 2009 Annual Report Download - page 47
Download and view the complete annual report
Please find page 47 of the 2009 Hyundai annual report below. You can navigate through the pages in the report by either clicking on the pages listed below, or by using the keyword search tool below to find specific information within the annual report.-
 1
1 -
2
-
3
-
4
-
5
-
6
-
7
-
8
-
9
-
10
-
11
-
12
-
13
-
14
-
15
-
16
-
17
-
18
-
19
-
20
-
21
-
22
-
23
-
24
-
25
-
26
-
27
-
28
-
29
-
30
-
31
-
32
-
33
-
34
-
35
-
36
-
 37
37 -
 38
38 -
 39
39 -
 40
40 -
 41
41 -
 42
42 -
 43
43 -
 44
44 -
 45
45 -
 46
46 -
 47
47 -
 48
48 -
 49
49 -
 50
50 -
 51
51 -
 52
52 -
 53
53 -
 54
54 -
 55
55 -
 56
56 -
 57
57 -
58
-
59
-
60
-
61
-
62
-
63
-
64
-
65
-
66
-
67
-
68
-
69
-
70
-
71
-
72
-
73
 |
 |
HYUNDAI MOTOR COMPANY I 2010 ANNUAL REPORT I 93HYUNDAI MOTOR COMPANY I 2010 ANNUAL REPORT I 92
HYUNDAI MOTOR COMPANY
>>
NOTES TO CONSOLIDATED FINANCIAL STATEMENTS FOR THE YEARS ENDED DECEMBER 31, 2009 AND 2008
HYUNDAI MOTOR COMPANY
>>
NOTES TO CONSOLIDATED FINANCIAL STATEMENTS FOR THE YEARS ENDED DECEMBER 31, 2009 AND 2008
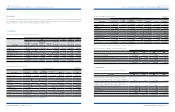
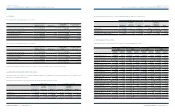
Affiliated company Acquisition cost Net equity value Book value Book value
Ownership
percentage (*2)
Rotem Equipments (Beijing) Co., Ltd. (*1) ₩ 190 ₩ 203 ₩ 203 $ 174 100.00
Hyundai Motor Brasil Montadora de
Automoveis LTDA (HMMB) (*1) 137 137 137 117 100.00
EUKOR Shipowning Singapore Pte Ltd. 8 3,475 2,541 2,176 20.00
Eukor Car Carriers Singapore Pte. Ltd. 5 5 5 4 8.00
Hyundai Rotem Automotive (*1) 3 124 124 106 100.00
₩ 1,486,197 ₩ 4,077,714 ₩ 3,895,695 $ 3,336,498
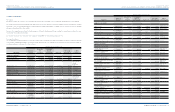
(*1) These companies are excluded in the consolidation since individual beginning balance of total assets is less than ₩10,000 million (US$8,565 thousand).
(*2) As the company was under the liquidation procedure, it was excluded from consolidated subsidiaries.
Korean Won in millions
U.S. Dollars (Note 2)
in thousands (%)
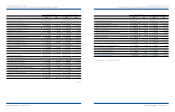
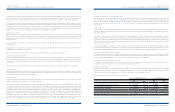
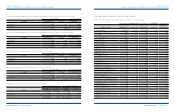
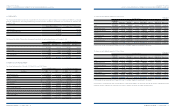
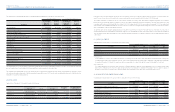
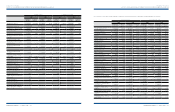
Investment securities accounted for using the equity method as of December 31, 2008 consist of the following:
(*1) These companies are excluded in the consolidation since individual beginning balance of total assets is less than ₩7,000 million (US$5,995 thousand).
(*2) As the company was under the liquidation procedure, it was excluded from consolidated subsidiaries.
Affiliated company Acquisition cost Net equity value Book value Book value
Ownership
percentage (*2)
Hyundai Steel Company ₩ 245,153 ₩ 1,061,240 ₩ 791,420 $ 677,818 21.39
Hyundai MOBIS 118,993 597,065 594,126 508,844 17.79
Korea Space & Aircraft Co., Ltd. 159,800 93,646 93,452 80,038 20.54
Eukor Car Carriers, Inc. 48,912 113,839 100,623 86,179 20.00
HK Mutual Savings Bank 37,114 17,071 26,391 22,603 15.49
Korea Economy Daily 34,141 29,428 32,133 27,520 24.90
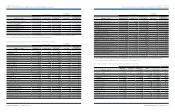
Kia Tigers Co., Ltd. (*1) 20,300 31 31 26 100.00
Donghui Auto Co., Ltd. 10,530 9,607 9,607 8,228 35.10
Hyundai Amco Co., Ltd. 10,067 74,236 73,161 62,659 19.99
TRW Steering Co., Ltd. 8,952 6,369 6,369 5,455 29.00
Korea Credit Bureau Co., Ltd. 3,800 2,108 3,205 2,745 7.00
Wisco Co., Ltd. 1,736 24,781 23,360 20,007 38.63
Iljin Bearing Co., Ltd. 826 16,843 16,843 14,425 20.00
Daesung Automotive Co., Ltd. 400 11,323 11,323 9,698 20.00
Seoul Sung Bo Chiup LLC 4,236 4,475 4,237 3,629 23.30
Morningstar Korea Co., Ltd. 5,006 1,541 2,673 2,289 39.90
Beijing-Hyundai Motor Company 397,758 840,705 825,829 707,288 50.00
Hyundai Motor Deutschland GmbH 6,761 23,178 22,715 19,454 30.00
Hyundai Motor Hungary (*2) 5,415 2,192 2,283 1,955 100.00
KEFICO Automotive Systems(Beijing) Co. Ltd. (*1) 725 595 595 510 100.00
Yan Ji Kia Motors A/S (*1) 1,792 1,792 1,792 1,535 100.00
Hyundai Motor Japan R&D Center Inc. (*1) 1,510 3,296 3,296 2,823 100.00
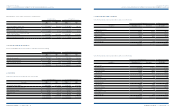
Affiliated company Acquisition cost Net equity value Book value Book value
Ownership
percentage (*2)
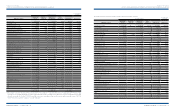
Autoever Systems China Co., Ltd. (*1) ₩ 538 ₩ 1,026 ₩ 1,026 $ 879 90.00
Autoever Systems India Pvt. Ltd. (*1) 520 1,089 1,089 933 100.00
MAINTRANCE (*1) 400 573 573 491 80.00
South Link9 200 712 712 610 20.00
Rotem Equipments (Beijing) Co., Ltd. (*1) 190 338 338 289 100.00
Eukor Car Carriers Singapore Pte. 5 5 5 4 8.00
Hyundai Rotem Automotive (*1) 3 86 86 74 100.00
Hyundai WIA Motor Dies Company (*1) 14,681 14,681 14,681 12,574 100.00
Hysco Czech S.R.O (*1) 13,162 14,227 14,329 12,272 100.00
Hyundai Autonet India Private Ltd. (HAIL) (*1) 4,308 4,802 4,308 3,690 100.00
HECT (*1) 3,972 5,277 5,277 4,519 100.00
Dymos India Automotive Private Limited (*1) 3,722 4,873 4,873 4,173 100.00
Beijing Lear Dymos Automotive Systems Co., Ltd. 2,662 7,138 7,195 6,162 40.00
Dymos Czech Republic s.r.o (*1) 2,553 (1,760) - - 100.00
Hyundai Autonet Europe (HAE) (*1) 1,005 1,237 1,005 861 100.00
Hyundai Autonet India Engineering (HAIE)(*1) 925 1,132 925 792 100.00
Hyundai Autonet America (HAA) (*1) 450 374 450 385 100.00
₩ 1,173,223 ₩ 2,991,171 ₩ 2,702,336 $ 2,314,436
Korean Won in millions
Korean Won in millions
U.S. Dollars (Note 2)
in thousands
U.S. Dollars (Note 2)
in thousands
(%)
(%)
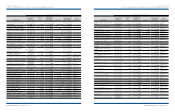
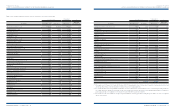
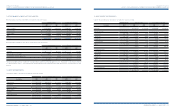
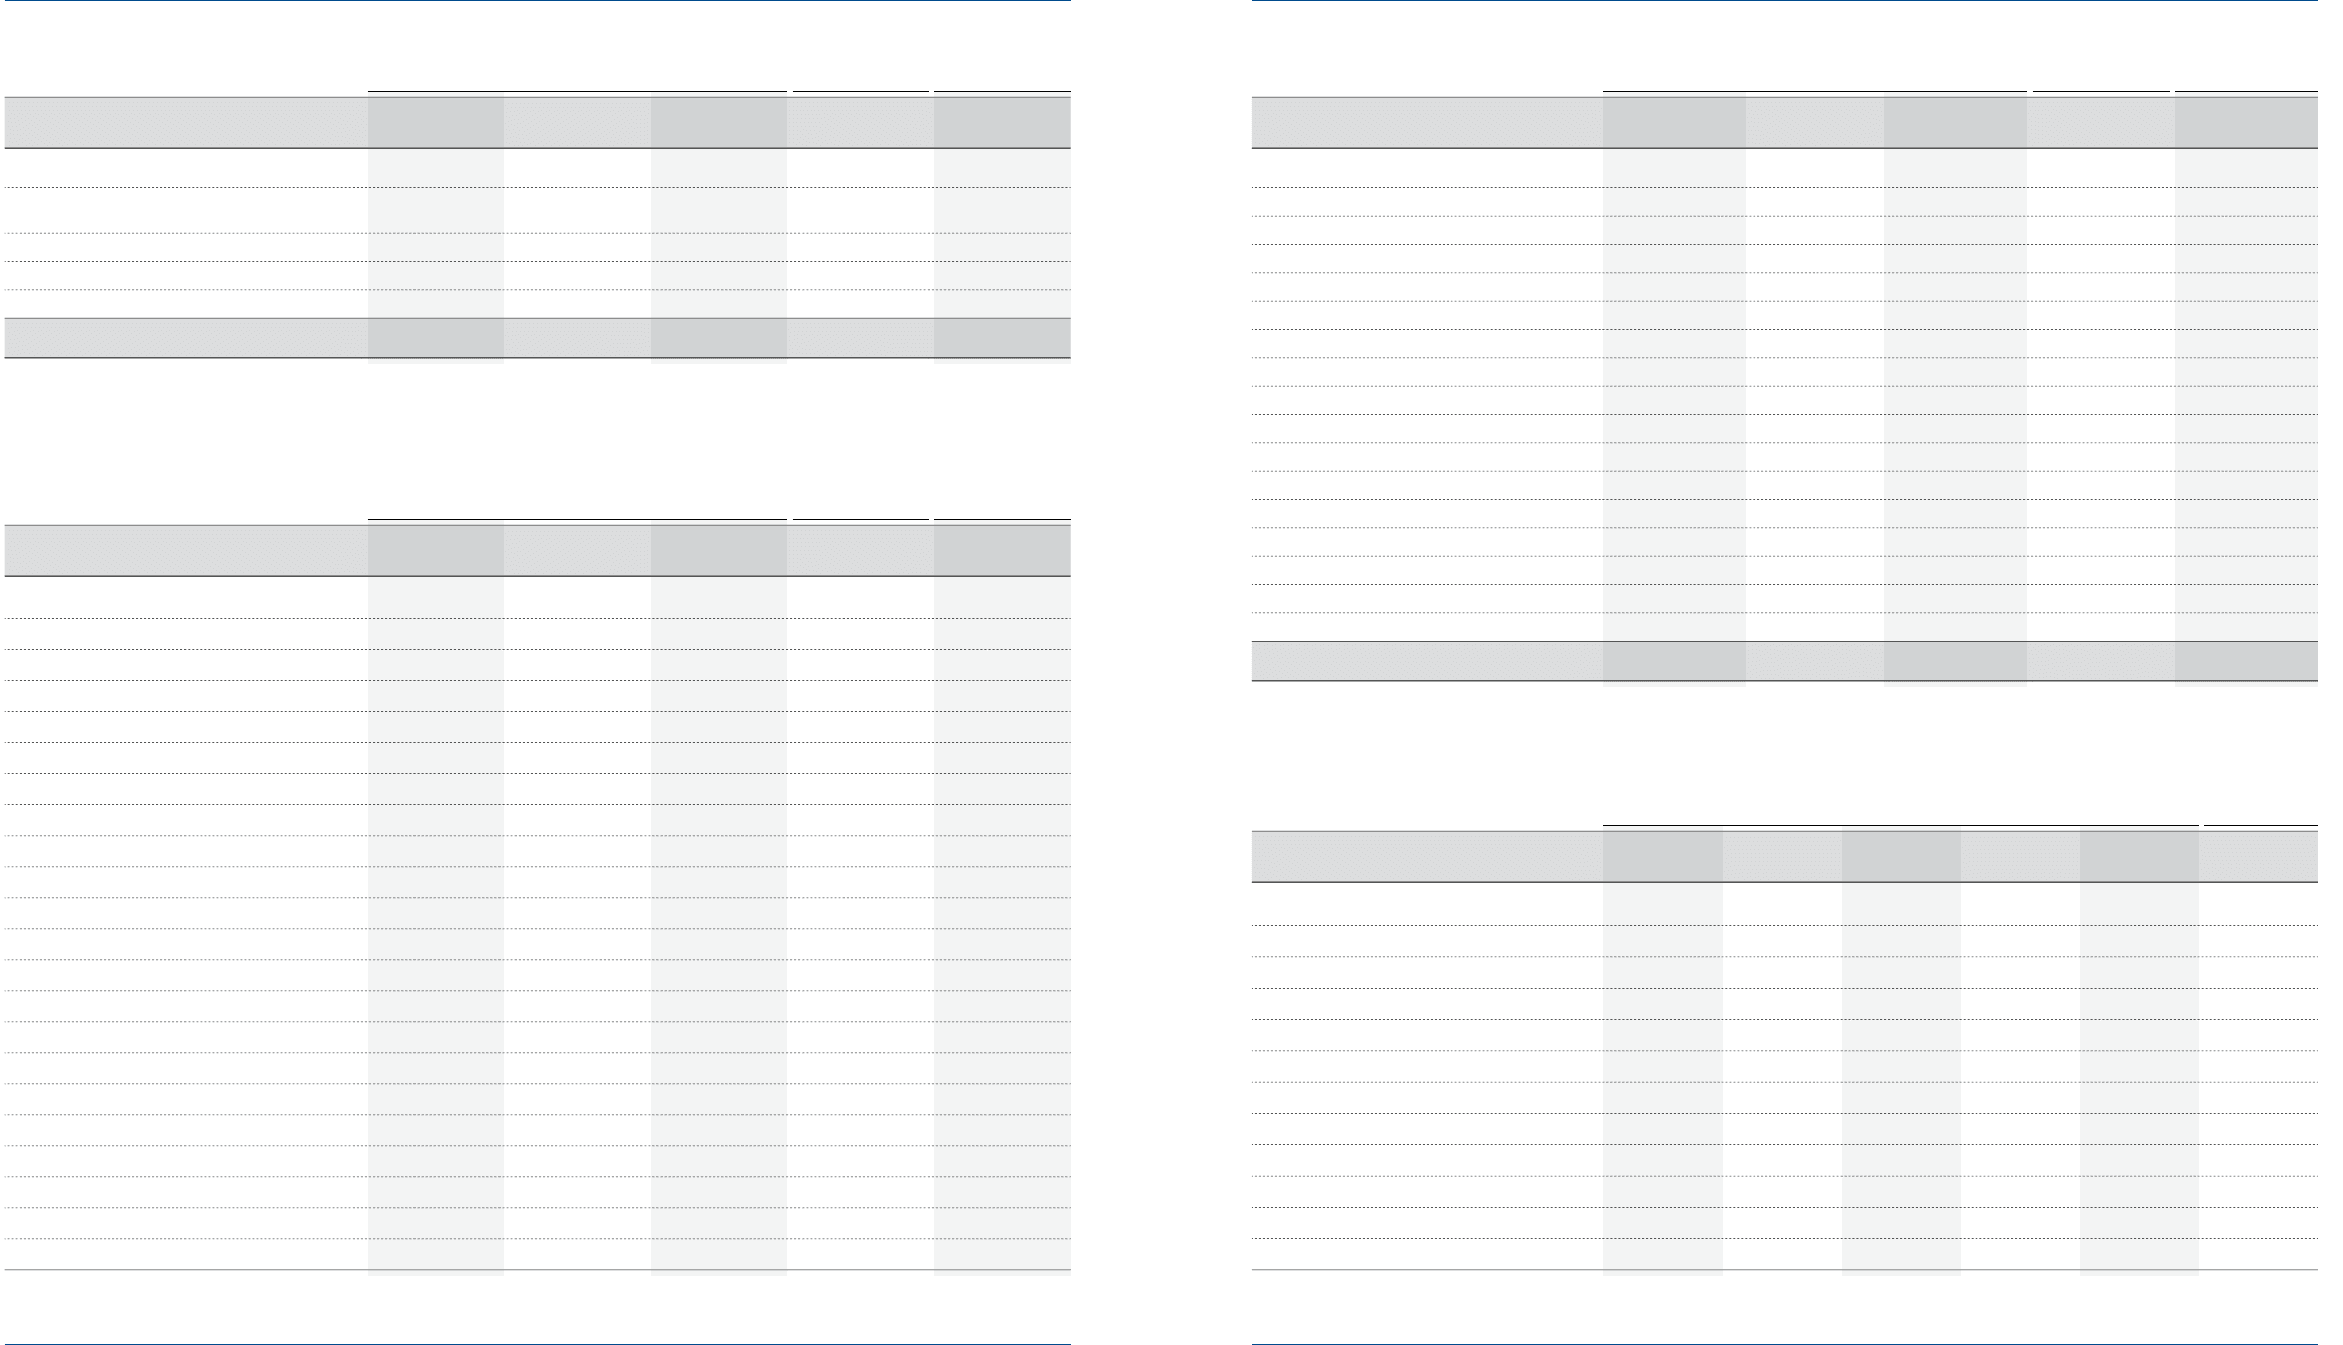
Affiliated company
Beginning
of year
Acquisition
(disposal)
Gain (loss)
on valuation
Other
changes (*) End of year End of year
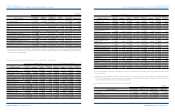
Hyundai Steel Company ₩ 791,420 ₩ - ₩ 239,377 ₩ 100,677 ₩ 1,131,474 $ 969,060
HMC Investment Securities Co., Ltd. - 72,448 500 142,346 215,294 184,390
Hyundai MOBIS 594,126 - 297,882 140,136 1,032,144 883,988
Korea Aerospace Industries, Ltd. 93,452 - 9,698 - 103,150 88,344
Eukor Car Carriers, Inc. 100,623 - 9,390 (5,126) 104,887 89,831
HK Mutual Savings Bank 26,391 8,605 (1,600) 2,403 35,799 30,660
Korea Economy Daily 32,133 - 2,011 (326) 33,818 28,964
Kia Tigers Co., Ltd. 31 - (31) - - -
Donghui Auto Co., Ltd. 9,607 - 1,196 - 10,803 9,252
Hyundai Amco Co., Ltd. 73,161 - 12,659 (4,284) 81,536 69,832
TRW Steering Co., Ltd. 6,369 - 162 - 6,531 5,594
Korea Credit Bureau Co., Ltd. 3,205 - (14) - 3,191 2,733
Korean Won in millions
U.S. Dollars (Note 2)
in thousands
(2) The changes in investment securities accounted for using the equity method in 2009 are as follows: