Hyundai 2009 Annual Report Download - page 34
Download and view the complete annual report
Please find page 34 of the 2009 Hyundai annual report below. You can navigate through the pages in the report by either clicking on the pages listed below, or by using the keyword search tool below to find specific information within the annual report.-
 1
1 -
2
-
3
-
4
-
5
-
6
-
7
-
8
-
9
-
10
-
11
-
12
-
13
-
14
-
15
-
16
-
17
-
18
-
19
-
20
-
21
-
22
-
23
-
 24
24 -
 25
25 -
 26
26 -
 27
27 -
 28
28 -
 29
29 -
 30
30 -
 31
31 -
 32
32 -
 33
33 -
 34
34 -
 35
35 -
 36
36 -
 37
37 -
 38
38 -
 39
39 -
 40
40 -
 41
41 -
 42
42 -
 43
43 -
 44
44 -
45
-
46
-
47
-
48
-
49
-
50
-
51
-
52
-
53
-
54
-
55
-
56
-
57
-
58
-
59
-
60
-
61
-
62
-
63
-
64
-
65
-
66
-
67
-
68
-
69
-
70
-
71
-
72
-
73
 |
 |

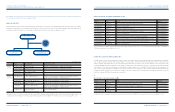
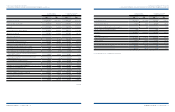
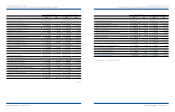
2009 2008 2009 2008
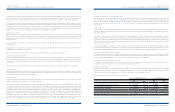
Income before income tax ₩ 5,557,772 ₩ 1,496,984 $ 4,759,997 $ 1,282,104
Income tax expense (Note 19) 1,517,276 409,919 1,299,483 351,078
Net loss of newly consolidated subsidiaries before acquisition - 5,487 - 4,699
Net gain on disposal of consolidated subsidiaries 2,940 - 2,518 -
Net income ₩ 4,043,436 ₩ 1,092,552 $ 3,463,032 $ 935,725
Attributable to:
Equity holders of the parent ₩ 2,973,473 ₩ 857,751 $ 2,546,654 $ 734,627
Minority interests 1,069,963 234,801 916,378 201,098
₩ 4,043,436 ₩ 1,092,552 $ 3,463,032 $ 935,725
Basic earnings per common share (Note 2) ₩ 10,947 ₩ 2,499 $ 9.38 $ 2.14
Diluted earnings per common share (Note 2) ₩ 10,947 ₩ 2,497 $ 9.38 $ 2.14
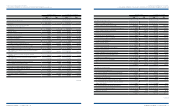
2009 2008 2009 2008
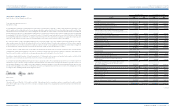
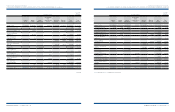
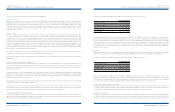
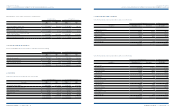
Sales (Notes 25, 26 and 30) ₩ 91,463,064 ₩ 79,736,351 $ 78,334,245 $ 68,290,811
Cost of sales (Notes 25, 26 and 30) 71,055,076 61,829,549 60,855,667 52,954,393
Gross profit 20,407,988 17,906,802 17,478,578 15,336,418
Selling and administrative expenses (Note 27) 14,787,747 14,834,759 12,665,079 12,705,343
Operating income (Note 30) 5,620,241 3,072,043 4,813,499 2,631,075
Other income (expenses), net:
Interest expense, net (871,531) (670,493) (746,429) (574,249)
Loss on foreign exchange transactions, net (230,336) (744,407) (197,273) (637,553)
Gain (loss) on foreign exchange translation, net 498,596 (2,354,804) 427,026 (2,016,790)
Loss on disposal of trade notes and accounts receivable (126,119) (165,566) (108,016) (141,800)
Gain on disposal of short-term investment securities, net 16,997 1,215 14,557 1,041
Gain on disposal of long-term investment securities, net 59,159 46,064 50,667 39,452
Gain on valuation of investment securities accounted for using the
equity method, net (Note 7) 914,103 356,972 782,891 305,731
Gain on disposal of investment securities accounted for using the
equity method, net (Note 7) 118,751 2,025 101,705 1,734
Loss on impairment of investment securities (12,230) (5,481) (10,474) (4,694)
Loss on disposal of property, plant and equipment, net (40,943) (61,389) (35,066) (52,577)
Impairment loss on property, plant and equipment (61,376) (33,966) (52,566) (29,090)
Impairment loss on intangibles (Note 11) (150,284) (2,747) (128,712) (2,353)
Rental and royalty income 211,617 113,682 181,241 97,364
Gain (loss) on valuation of derivatives, net (Note 29) (475,251) 1,790,314 (407,032) 1,533,328
Gain on derivatives transaction, net 73,354 106,863 62,825 91,524
Other, net 13,024 46,659 11,154 39,961
(62,469) (1,575,059) (53,502) (1,348,971)
See accompanying notes to consolidated financial statements.
HYUNDAI MOTOR COMPANY AND SUBSIDIARIES
>>
CONSOLIDATED STATEMENTS OF INCOME FOR THE YEARS ENDED DECEMBER 31, 2009 AND 2008
HYUNDAI MOTOR COMPANY AND SUBSIDIARIES
>>
CONSOLIDATED STATEMENTS OF INCOME (CONTINUED) FOR THE YEARS ENDED DECEMBER 31, 2009 AND 2008
Korean Won in millions,
except per share amounts
Korean Won in millions,
except per share amounts
U. S. Dollars (Note 2) in thousands,
except per share amounts
U. S. Dollars (Note 2) in thousands,
except per share amounts
HYUNDAI MOTOR COMPANY I 2010 ANNUAL REPORT I 67HYUNDAI MOTOR COMPANY I 2010 ANNUAL REPORT I 66
(Continued)