Hyundai 2009 Annual Report Download - page 43
Download and view the complete annual report
Please find page 43 of the 2009 Hyundai annual report below. You can navigate through the pages in the report by either clicking on the pages listed below, or by using the keyword search tool below to find specific information within the annual report.-
 1
1 -
2
-
3
-
4
-
5
-
6
-
7
-
8
-
9
-
10
-
11
-
12
-
13
-
14
-
15
-
16
-
17
-
18
-
19
-
20
-
21
-
22
-
23
-
24
-
25
-
26
-
27
-
28
-
29
-
30
-
31
-
32
-
 33
33 -
 34
34 -
 35
35 -
 36
36 -
 37
37 -
 38
38 -
 39
39 -
 40
40 -
 41
41 -
 42
42 -
 43
43 -
 44
44 -
 45
45 -
 46
46 -
 47
47 -
 48
48 -
 49
49 -
 50
50 -
 51
51 -
 52
52 -
 53
53 -
54
-
55
-
56
-
57
-
58
-
59
-
60
-
61
-
62
-
63
-
64
-
65
-
66
-
67
-
68
-
69
-
70
-
71
-
72
-
73
 |
 |

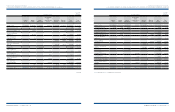
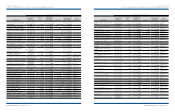
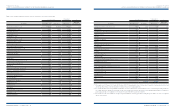
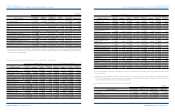
Description Acquisition cost Book value Book value
Trading securities:
Government bonds ₩ 554,159 ₩ 558,089 $ 477,980
Beneficiary certificates 127,195 124,807 106,892
Corporate bonds 139,681 139,705 119,651
Equity securities 5,460 5,330 4,565
Stock warrants 280 280 240
Available-for-sale securities:
Government bonds 215 215 184
Corporate bond 13,861 13,863 11,873
Beneficiary certificates 220,200 220,363 188,732
Equity securities 1,524 119 102
Held-to-maturity securities:
Government bonds 2,658 2,658 2,276
₩ 1,065,233 ₩ 1,065,429 $ 912,495
Accounts 2009 2008 2009 2008
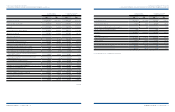
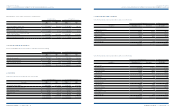
Finished goods and merchandise ₩ 6,913,946 ₩ 10,714,429 $ 5,921,502 $ 9,176,455
Semi finished goods and work in process 1,269,412 1,531,094 1,087,198 1,311,317
Raw materials and supplies 1,866,346 2,443,046 1,598,446 2,092,366
Materials in transit 639,987 682,798 548,122 584,788
Other 1,005,460 1,569,126 861,134 1,343,890
₩ 11,695,151 ₩ 16,940,493 $ 10,016,402 $ 14,508,816
2009 2008 2009 2008
Cash and cash equivalents ₩ 373,817 ₩ 232,829 $ 320,158 $ 199,408
Short-term financial instruments 139,539 178,917 119,509 153,235
Long-term financial instruments 26,520 5,430 22,714 4,651
₩ 539,876 ₩ 417,176 $ 462,381 $ 357,294
2009 2008 2009 2008
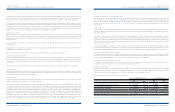
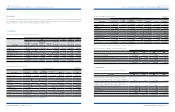
Net income available to common share ₩ 2,290,696 ₩ 521,952 $ 1,961,884 $ 447,030
Expenses related to diluted securities - - - -
Net income available to diluted common share 2,290,696 521,952 1,961,884 447,030
Weighted average number of common shares and
diluted securities outstanding 209,252,481 209,068,481 209,252,481 209,068,481
Diluted earnings per common share ₩ 10,947 ₩ 2,497 $ 9.38 $ 2.14
HYUNDAI MOTOR COMPANY I 2010 ANNUAL REPORT I 85HYUNDAI MOTOR COMPANY I 2010 ANNUAL REPORT I 84
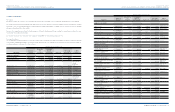
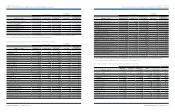
Diluted earnings per common share in 2009 and 2008 is computed as follows:
Korean Won in millions,
except per share amounts
U. S. Dollars (Note 2)
in thousands, except per share amounts
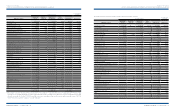
3. RESTRICTED FINANCIAL INSTRUMENTS:
Deposits with withdrawal restrictions as of December 31, 2009 and 2008 consist of the following:
Korean Won in millions
4. INVENTORIES:
Inventories as of December 31, 2009 and 2008 consist of the following:
Korean Won in millions
U. S. Dollars (Note 2) in thousands
U. S. Dollars (Note 2) in thousands
HYUNDAI MOTOR COMPANY
>>
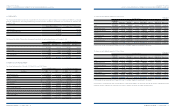
NOTES TO CONSOLIDATED FINANCIAL STATEMENTS FOR THE YEARS ENDED DECEMBER 31, 2009 AND 2008
HYUNDAI MOTOR COMPANY
>>
NOTES TO CONSOLIDATED FINANCIAL STATEMENTS FOR THE YEARS ENDED DECEMBER 31, 2009 AND 2008
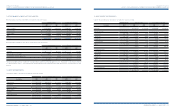
5. SHORT-TERM INVESTMENT SECURITIES:
(1) Short-term investment securities as of December 31, 2009 consist of the following:
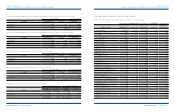
(2) Short-term investment securities as of December 31, 2008 consist of the following:
Korean Won in millions
Korean Won in millions
U. S. Dollars (Note 2) in thousands
U. S. Dollars (Note 2) in thousands
Description Acquisition cost Book value Book value
Available-for-sale securities:
Corporate bond ₩ 4,800 ₩ 4,800 $ 4,111
Beneficiary certificates 150,000 163,526 140,053
Equity securities 19,568 82,577 70,724
Held-to-maturity securities:
Government bonds 1,699 1,699 1,455
₩ 176,067 ₩ 252,602 $ 216,343