Google 2014 Annual Report Download - page 38
Download and view the complete annual report
Please find page 38 of the 2014 Google annual report below. You can navigate through the pages in the report by either clicking on the pages listed below, or by using the keyword search tool below to find specific information within the annual report.-
 1
1 -
2
-
3
-
4
-
5
-
6
-
7
-
8
-
9
-
10
-
11
-
12
-
13
-
14
-
15
-
16
-
17
-
18
-
19
-
20
-
21
-
22
-
23
-
24
-
25
-
26
-
27
-
 28
28 -
 29
29 -
 30
30 -
 31
31 -
 32
32 -
 33
33 -
 34
34 -
 35
35 -
 36
36 -
 37
37 -
 38
38 -
 39
39 -
 40
40 -
 41
41 -
 42
42 -
 43
43 -
 44
44 -
 45
45 -
 46
46 -
 47
47 -
 48
48 -
49
-
50
-
51
-
52
-
53
-
54
-
55
-
56
-
57
-
58
-
59
-
60
-
61
-
62
-
63
-
64
-
65
-
66
-
67
-
68
-
69
-
70
-
71
-
72
-
73
-
74
-
75
-
76
-
77
-
78
-
79
-
80
-
81
-
82
-
83
-
84
-
85
-
86
-
87
-
88
-
89
-
90
-
91
-
92
 |
 |

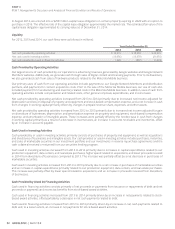
In August 2013, we entered into a $258 million capital lease obligation on certain property expiring in 2028 with an option to
capital lease obligation approximated its carrying value as of December 31, 2014.
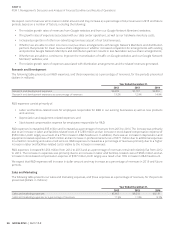
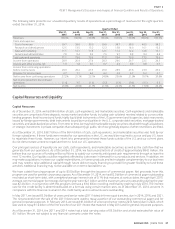
Liquidity
Year Ended December31,
2012 2013 2014
Net cash provided by operating activities $ 16,619 $ 18,659 $ 22,376
Net cash used in investing activities (13,056) (13,679) (21,055)
1,229 (857) (1,439)
Cash Provided by Operating Activities
Our largest source of cash provided by our operations is advertising revenues generated by Google websites and Google Network
Members websites. Additionally, we generate cash through sales of digital content and licensing payments. Prior to its divestiture,
we also generated cash from sales of hardware products related to the Motorola Mobile business.
Our primary uses of cash from our operating activities include payments to our Google Network Members and distribution
partners, and payments for content acquisition costs. Prior to the sale of the Motorola Mobile business, our use of cash also
included payment for manufacturing and inventory-related costs in the Motorola Mobile business. In addition, uses of cash from
operating activities include compensation and related costs, other general corporate expenditures, and income taxes.
Net cash provided by operating activities increased from 2013 to 2014 primarily due to increased net income adjusted for
depreciation and loss on disposal of property and equipment and stock-based compensation expense, and a net increase in cash
from changes in working capital primarily driven by changes in prepaid revenue share, expenses, and other assets.
Net cash provided by operating activities increased from 2012 to 2013 primarily due to increased net income adjusted for gain
on divestiture of businesses, depreciation and amortization expense on property and equipment, stock-based compensation
by an increase in accounts payable.
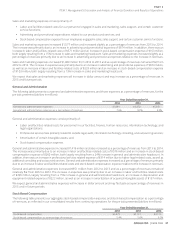
Cash Used in Investing Activities
Cash provided by or used in investing activities primarily consists of purchases of property and equipment, as well as acquisitions
and divestitures of businesses and intangible assets. Our cash provided or used in investing activities includes purchases, maturities,
and sales of marketable securities in our investment portfolio and our investments in reverse repurchase agreements and the
cash collateral received or returned from our securities lending program.
Cash used in investing activities increased from 2013 to 2014 primarily due to increases in capital expenditures related to our
production equipment, data centers, and real estate purchases, higher spend related to acquisitions, and lower proceeds received
marketable securities.
Cash used in investing activities increased from 2012 to 2013 primarily due to a net increase in purchases of marketable securities
and an increase in capital expenditures primarily related to our production equipment, data centers, and real estate purchases.
of businesses.
Cash Provided by (Used in) Financing Activities
debt and, to a lesser extent, an increase in net payments for stock-based award activities.
32
GOOGLE INC.
PART II