Google 2014 Annual Report Download - page 27
Download and view the complete annual report
Please find page 27 of the 2014 Google annual report below. You can navigate through the pages in the report by either clicking on the pages listed below, or by using the keyword search tool below to find specific information within the annual report.-
 1
1 -
2
-
3
-
4
-
5
-
6
-
7
-
8
-
9
-
10
-
11
-
12
-
13
-
14
-
15
-
16
-
 17
17 -
 18
18 -
 19
19 -
 20
20 -
 21
21 -
 22
22 -
 23
23 -
 24
24 -
 25
25 -
 26
26 -
 27
27 -
 28
28 -
 29
29 -
 30
30 -
 31
31 -
 32
32 -
 33
33 -
 34
34 -
 35
35 -
 36
36 -
 37
37 -
38
-
39
-
40
-
41
-
42
-
43
-
44
-
45
-
46
-
47
-
48
-
49
-
50
-
51
-
52
-
53
-
54
-
55
-
56
-
57
-
58
-
59
-
60
-
61
-
62
-
63
-
64
-
65
-
66
-
67
-
68
-
69
-
70
-
71
-
72
-
73
-
74
-
75
-
76
-
77
-
78
-
79
-
80
-
81
-
82
-
83
-
84
-
85
-
86
-
87
-
88
-
89
-
90
-
91
-
92
 |
 |

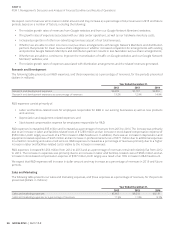
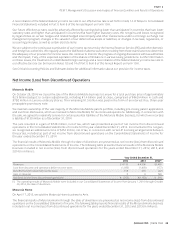
•Our employees are critical to our success and we expect to continue investing in them.
Our employees are among our best assets and are critical for our continued success. Their energy and talent drive Google and
create our success. We expect to continue hiring talented employees and to provide competitive compensation programs to
our employees. As of December 31, 2014, we had 53,600 full-time employees: 20,832 in research and development, 17,621 in
sales and marketing, 7,510 in general and administrative, and 7,637 in operations, an increase of 9,738 total headcount from
December 31, 2013.
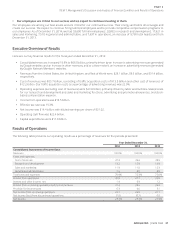
Executive Overview of Results
•
Consolidated revenues increased 18.9% to $66.0 billion, primarily driven by an increase in advertising revenues generated
by Google websites and an increase in other revenues, and to a lesser extent, an increase in advertising revenues generated
•
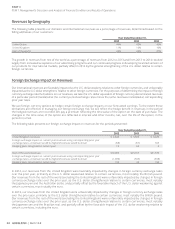
Revenues from the United States, the United Kingdom, and Rest of World were, $28.1 billion, $6.5 billion, and $31.4 billion,
respectively.
•
•
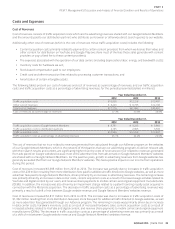
Operating expenses (excluding cost of revenues) were $23.8 billion, primarily driven by labor and facilities-related costs
for our research and development and sales and marketing functions, advertising and promotional expenses, and stock-
based compensation expense.
•Income from operations was $16.5 billion.
•
•Net income was $14.4 billion with diluted earnings per share of $21.02.
•
•Capital expenditures were $11.0 billion.
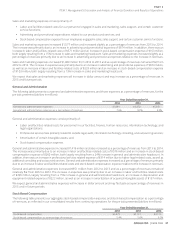
Results of Operations
The following table presents our operating results as a percentage of revenues for the periods presented:
Year Ended December31,
2012 2013 2014
Consolidated Statements of Income Data:
Revenues 100.0% 100.0% 100.0%
Costs and expenses:
Cost of revenues 37.3 39.6 38.9
Research and development 13.2 12.9 14.9
Sales and marketing 11.9 11.8 12.3
General and administrative 7.6 8.0 8.9
Total costs and expenses 70.0% 72.3% 75.0%
Income from operations 30.0 27.7 25.0
Interest and other income, net 1.4 0.9 1.2
Income from continuing operations before income taxes 31.4 28.6 26.2
Provision for income taxes 6.3 4.6 5.1
Net income from continuing operations 25.1 24.0 21.1
Net income (loss) from discontinued operations (1.8) (0.7) 0.8
Net income 23.3% 23.3% 21.9%
21GOOGLE INC.