Google 2014 Annual Report Download - page 29
Download and view the complete annual report
Please find page 29 of the 2014 Google annual report below. You can navigate through the pages in the report by either clicking on the pages listed below, or by using the keyword search tool below to find specific information within the annual report.-
 1
1 -
2
-
3
-
4
-
5
-
6
-
7
-
8
-
9
-
10
-
11
-
12
-
13
-
14
-
15
-
16
-
17
-
18
-
 19
19 -
 20
20 -
 21
21 -
 22
22 -
 23
23 -
 24
24 -
 25
25 -
 26
26 -
 27
27 -
 28
28 -
 29
29 -
 30
30 -
 31
31 -
 32
32 -
 33
33 -
 34
34 -
 35
35 -
 36
36 -
 37
37 -
 38
38 -
 39
39 -
40
-
41
-
42
-
43
-
44
-
45
-
46
-
47
-
48
-
49
-
50
-
51
-
52
-
53
-
54
-
55
-
56
-
57
-
58
-
59
-
60
-
61
-
62
-
63
-
64
-
65
-
66
-
67
-
68
-
69
-
70
-
71
-
72
-
73
-
74
-
75
-
76
-
77
-
78
-
79
-
80
-
81
-
82
-
83
-
84
-
85
-
86
-
87
-
88
-
89
-
90
-
91
-
92
 |
 |

decreased approximately 8% from 2012 to 2013. The decrease in the average cost-per-click paid by our advertisers was
driven by various factors, such as the geographic mix, device mix, property mix, ongoing product and policy changes, and
the general strengthening of the U.S. dollar compared to certain foreign currencies.
Our revenue growth rate has generally declined over time as a result of a number of factors, including increasing competition,
query growth rates, challenges in maintaining our growth rate as our revenues increase to higher levels, the evolution of the online
advertising market, our investments in new business strategies, changes in our product mix, and shifts in the geographic mix of
trends, the acceptance by users of our products and services as they are delivered on diverse devices, and our ability to create
a seamless experience for both users and advertisers.
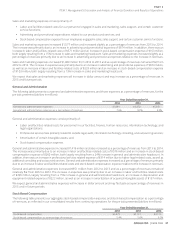
The following table presents the changes in our paid clicks and cost-per-click for the periods presented (in percentage terms):
Change from
2012 to 2013
Change from
2013 to 2014
Aggregate paid clicks 25% 20%
Paid clicks on Google websites(1) 33% 29%
(2) 11% 2%
Aggregate cost-per-click (8)% (5)%
Cost-per-click on Google websites (10)% (7)%
(8)% (6)%
(1) Paid clicks on Google websites include clicks related to ads served on Google owned and operated properties across different geographies
and devices, including search, YouTube engagement ads like TrueView, and other owned and operated properties including Maps and
Finance.
AdSense for Search, AdSense for Content, and AdMob businesses.
The rate of change in revenues, as well as the rate of change in paid clicks and average cost-per-click on Google websites and
Google Network Members
in the future because of various factors, including:
•growth rates of our revenues from Google websites compared to those of our revenues from Google Network Members
websites;
•advertiser competition for keywords;
•changes in foreign currency exchange rates;
•seasonality;
•the fees advertisers are willing to pay based on how they manage their advertising costs;
•changes in advertising quality or formats;
•
•
a shift in the proportion of non-click based revenue generated in Google websites and Google Network Members websites; and
•general economic conditions.
Changes in aggregate paid clicks and average cost-per-click on Google websites and Google Network Members websites may not
Other Revenues
Other revenues increased $1,973 million from 2013 to 2014 and also increased as a percentage of total revenues. The increase
was primarily due to growth of our sales of digital content products, such as apps, music, and movies on the Google Play store.
Other revenues increased $2,619 million from 2012 to 2013 and also increased as a percentage of revenues. The increase was
primarily due to growth of our digital content products, such as apps, music, and movies. We also experienced an increase in our
hardware revenues due to increased sales of Chromecast, directly-sold Nexus products, and Chrome OS devices.
23GOOGLE INC.