GE 2006 Annual Report Download - page 97
Download and view the complete annual report
Please find page 97 of the 2006 GE annual report below. You can navigate through the pages in the report by either clicking on the pages listed below, or by using the keyword search tool below to find specific information within the annual report.-
 1
1 -
2
-
3
-
4
-
5
-
6
-
7
-
8
-
9
-
10
-
11
-
12
-
13
-
14
-
15
-
16
-
17
-
18
-
19
-
20
-
21
-
22
-
23
-
24
-
25
-
26
-
27
-
28
-
29
-
30
-
31
-
32
-
33
-
34
-
35
-
36
-
37
-
38
-
39
-
40
-
41
-
42
-
43
-
44
-
45
-
46
-
47
-
48
-
49
-
50
-
51
-
52
-
53
-
54
-
55
-
56
-
57
-
58
-
59
-
60
-
61
-
62
-
63
-
64
-
65
-
66
-
67
-
68
-
69
-
70
-
71
-
72
-
73
-
74
-
75
-
76
-
77
-
78
-
79
-
80
-
81
-
82
-
83
-
84
-
85
-
86
-
 87
87 -
 88
88 -
 89
89 -
 90
90 -
 91
91 -
 92
92 -
 93
93 -
 94
94 -
 95
95 -
 96
96 -
 97
97 -
 98
98 -
 99
99 -
 100
100 -
 101
101 -
 102
102 -
 103
103 -
 104
104 -
 105
105 -
 106
106 -
 107
107 -
108
-
109
-
110
-
111
-
112
-
113
-
114
-
115
-
116
-
117
-
118
-
119
-
120
 |
 |

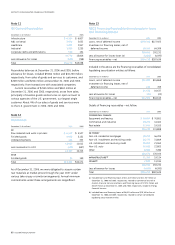
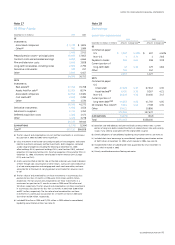
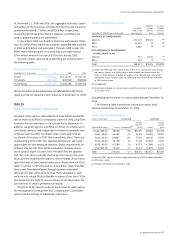
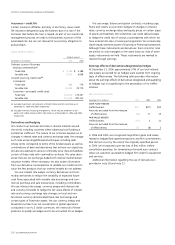
Note 19
GECS Investment Contracts, Insurance Liabilities
and Insurance Annuity Benefits
December 31 (In millions) 2006 2005
Investment contracts $ 5,089 $ 6,034
Guaranteed investment contracts of SPEs 11,870 11,685
Total investment contracts
Life insurance benefi ts
(a)
16,959
14,054
17,719
13,220
Unpaid claims and claims adjustment expenses
Unearned premiums
Universal life benefits
2,714
740
340
1,707
401
340
Total $34,807 $33,387
(a) Life insurance benefits are accounted for mainly by a net-level-premium method
using estimated yields generally ranging from 3.0% to 8.5% in both 2006 and 2005.
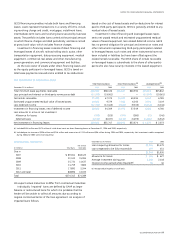
When insurance affiliates cede insurance to third parties, they are
not relieved of their primary obligation to policyholders. Losses on
ceded risks give rise to claims for recovery; we establish allow-
ances for probable losses on such receivables from reinsurers as
required.
We recognize reinsurance recoveries as a reduction of the
Statement of Earnings caption “Investment contracts, insurance
losses and insurance annuity benefits.” Reinsurance recoveries
were $162 million, $183 million and $223 million for the years
ended December 31, 2006, 2005 and 2004, respectively.
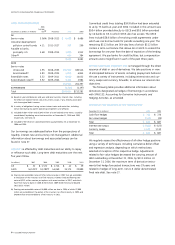
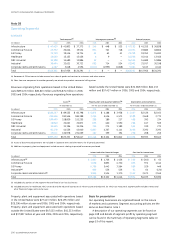
Note 20
All Other Liabilities
This caption includes liabilities for various items including non-
current compensation and benefits, deferred income, interest on
tax liabilities, accrued participation and residuals, environmental
remediation, asset retirement obligations, derivative instruments,
product warranties and a variety of sundry items.
Accruals for non-current compensation and benefi ts amounted
to $17,214 million and $13,856 million for year-end 2006 and 2005,
respectively. These amounts include postretirement benefi ts,
international and supplemental pension benefits, and other
compensation and benefit accruals such as deferred incentive
compensation. The increase in 2006 reflected our adoption of
SFAS 158, Employers’ Accounting for Defi ned Benefi t Pension and
Other Postretirement Plans, as of December 31, 2006.
We are involved in numerous remediation actions to clean up
hazardous wastes as required by federal and state laws. Liabilities
for remediation costs at each site are based on our best estimate
of undiscounted future costs, excluding possible insurance recov-
eries. When there appears to be a range of possible costs with
equal likelihood, liabilities are based on the low end of such range.
Uncertainties about the status of laws, regulations, technology and
information related to individual sites make it difficult to develop a
meaningful estimate of the reasonably possible aggregate environ-
mental remediation exposure. However, even in the unlikely event
that remediation costs amounted to the high end of the range of
costs for each site, the resulting additional liability would not be
material to our financial position, results of operations or liquidity.
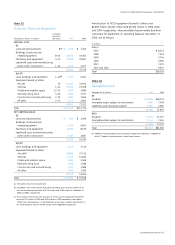
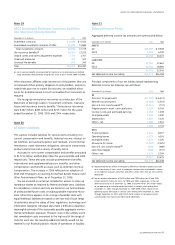
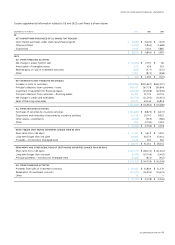
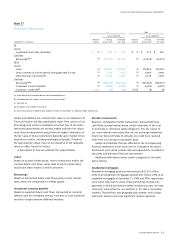
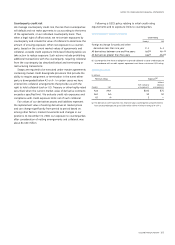
Note 21
Deferred Income Taxes
Aggregate deferred income tax amounts are summarized below.
December 31 (In millions) 2006 2005
ASSETS
GE $11,990 $ 9,928
GECS 8,563 6,209
20,553 16,137
LIABILITIES
GE 13,944 13,661
GECS 20,780 18,684
34,724 32,345
Net deferred income tax liability $14,171 $16,208
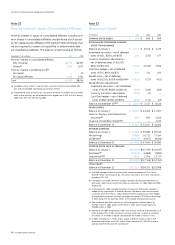
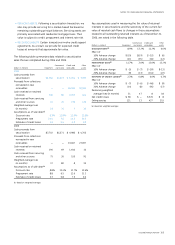
Principal components of our net liability (asset) representing
deferred income tax balances are as follows:
December 31 (In millions) 2006 2005
GE
Provision for expenses
(a)
Retiree insurance plans
Non-U.S. loss carryforwards
(b)
Prepaid pension asset — principal plans
Contract costs and estimated earnings
Intangible assets
Depreciation
Other — net
$ (7,218)
(2,654)
(1,214)
5,257
2,053
1,934
1,830
1,966
$ (6,521)
(1,503)
(731)
6,249
1,078
1,490
2,130
1,541
1,954 3,733
GECS
Financing leases
Operating leases
Intangible assets
Allowance for losses
Non-U.S. loss carryforwards
(b)
Cash fl ow hedges
Other — net
8,314
4,327
1,278
(1,763)
(835)
(226)
1,122
8,037
4,024
1,195
(2,025)
(688)
(372)
2,304
12,217 12,475
Net deferred income tax liability $14,171 $16,208
(a) Represented the tax effects of temporary differences related to expense accruals
for a wide variety of items, such as employee compensation and benefi ts, interest
on tax liabilities, product warranties and other sundry items that are not currently
deductible.
(b) Net of valuation allowances of $679 million and $890 million for GE and $203
million and $132 million for GECS, for 2006 and 2005, respectively. Of the net
deferred tax asset as of December 31, 2006, of $2,049 million, $41 million relates
to net operating loss carryforwards that expire in various years ending from
December 31, 2007, through December 31, 2009, $698 million relates to net
operating losses that expire in various years ending from December 31, 2010,
through December 31, 2021, and $1,310 million relates to net operating loss
carryforwards that may be carried forward indefi nitely.
ge 2006 annual report 95