GE 2006 Annual Report Download - page 112
Download and view the complete annual report
Please find page 112 of the 2006 GE annual report below. You can navigate through the pages in the report by either clicking on the pages listed below, or by using the keyword search tool below to find specific information within the annual report.-
 1
1 -
2
-
3
-
4
-
5
-
6
-
7
-
8
-
9
-
10
-
11
-
12
-
13
-
14
-
15
-
16
-
17
-
18
-
19
-
20
-
21
-
22
-
23
-
24
-
25
-
26
-
27
-
28
-
29
-
30
-
31
-
32
-
33
-
34
-
35
-
36
-
37
-
38
-
39
-
40
-
41
-
42
-
43
-
44
-
45
-
46
-
47
-
48
-
49
-
50
-
51
-
52
-
53
-
54
-
55
-
56
-
57
-
58
-
59
-
60
-
61
-
62
-
63
-
64
-
65
-
66
-
67
-
68
-
69
-
70
-
71
-
72
-
73
-
74
-
75
-
76
-
77
-
78
-
79
-
80
-
81
-
82
-
83
-
84
-
85
-
86
-
87
-
88
-
89
-
90
-
91
-
92
-
93
-
94
-
95
-
96
-
97
-
98
-
99
-
100
-
101
-
 102
102 -
 103
103 -
 104
104 -
 105
105 -
 106
106 -
 107
107 -
 108
108 -
 109
109 -
 110
110 -
 111
111 -
 112
112 -
 113
113 -
 114
114 -
 115
115 -
 116
116 -
 117
117 -
 118
118 -
 119
119 -
 120
120
 |
 |

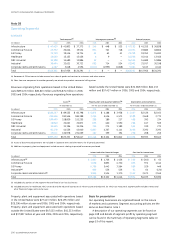
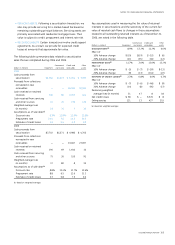
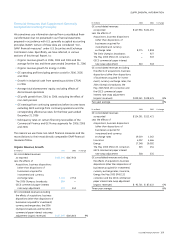
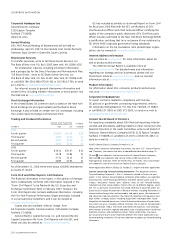
Organic Revenue Growth for Energy
(In millions) 2006 2005 % change
Energy revenues as reported $19,133 $16,525
Less the effects of
Acquisitions, business dispositions
(other than dispositions of
businesses acquired for
investment) and currency
exchange rates 72 98
Energy revenues excluding the
effects of acquisitions, business
dispositions (other than dispositions
of businesses acquired for invest-
ment) and currency exchange
rates (organic revenues) $19,061 $16,427 16%
GE Operating Profit Excluding Pension
2006 2005 2004
(In millions) Revenues
Operating
Profit Profit % Revenues
Operating
Profit Profit % Revenues
Operating
Profit Profit %
GE revenues and operating
profi t as reported $101,798 $14,585 14.3% $92,194 $13,316 14.4% $83,290 $11,384 13.7%
Less pension costs — (877) — (329) — 124
GE revenues, operating profi t
and operating profi t %
excluding the effects of
pension costs $101,798 $15,462 15.2% $92,194 $13,645 14.8% $83,290 $11,260 13.5%
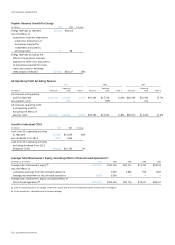
Growth in Industrial CFOA
(In millions) 2006 2005 % change
Cash from GE’s operating activities
as reported
Less dividends from GECS
$24,627
9,847
$21,609
7,816
14%
Cash from GE’s operating activities
excluding dividends from GECS
(Industrial CFOA) $14,780 $13,793 7%
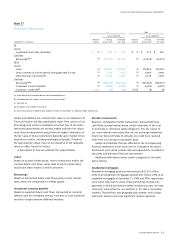
Average Total Shareowners’ Equity, Excluding Effects of Discontinued Operations(a)
December 31 (In millions) 2006 2005 2004 2003 2002
Average total shareowners’ equity
(b) $109,873 $111,706 $95,711 $71,342 $59,154
Less the effects of
Cumulative earnings from discontinued operations — 2,094 2,985 925 1,007
Average net investment in discontinued operations 4,050 5,066 — — —
Average total shareowners’ equity, excluding effects of
discontinued operations(a) $105,823 $104,546 $92,726 $70,417 $58,147
(a) Used for computing return on average shareowners’ equity and return on average total capital invested shown on page 67.
(b) On an annual basis, calculated using a fi ve-point average.
110 ge 2006 annual report