GE 2006 Annual Report Download - page 85
Download and view the complete annual report
Please find page 85 of the 2006 GE annual report below. You can navigate through the pages in the report by either clicking on the pages listed below, or by using the keyword search tool below to find specific information within the annual report.-
 1
1 -
2
-
3
-
4
-
5
-
6
-
7
-
8
-
9
-
10
-
11
-
12
-
13
-
14
-
15
-
16
-
17
-
18
-
19
-
20
-
21
-
22
-
23
-
24
-
25
-
26
-
27
-
28
-
29
-
30
-
31
-
32
-
33
-
34
-
35
-
36
-
37
-
38
-
39
-
40
-
41
-
42
-
43
-
44
-
45
-
46
-
47
-
48
-
49
-
50
-
51
-
52
-
53
-
54
-
55
-
56
-
57
-
58
-
59
-
60
-
61
-
62
-
63
-
64
-
65
-
66
-
67
-
68
-
69
-
70
-
71
-
72
-
73
-
74
-
 75
75 -
 76
76 -
 77
77 -
 78
78 -
 79
79 -
 80
80 -
 81
81 -
 82
82 -
 83
83 -
 84
84 -
 85
85 -
 86
86 -
 87
87 -
 88
88 -
 89
89 -
 90
90 -
 91
91 -
 92
92 -
 93
93 -
 94
94 -
 95
95 -
96
-
97
-
98
-
99
-
100
-
101
-
102
-
103
-
104
-
105
-
106
-
107
-
108
-
109
-
110
-
111
-
112
-
113
-
114
-
115
-
116
-
117
-
118
-
119
-
120
 |
 |

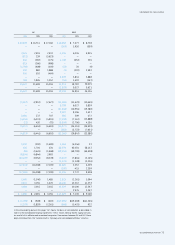
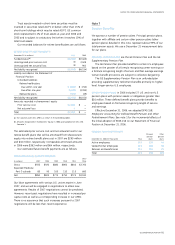
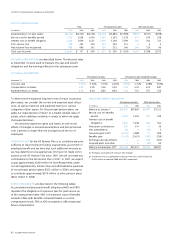
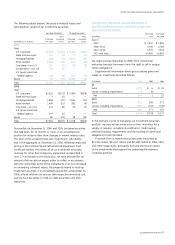
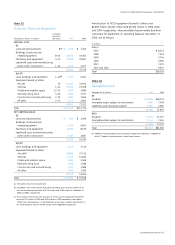
ABO balances for our pension plans follow.
ACCUMULATED BENEFIT OBLIGATION
December 31 (In millions)
GE Pension Plan
GE Supplementary Pension Plan
Other pension plans
2006
$38,137
2,314
8,053
2005
$38,044
2,178
7,194
Following is information about our pension plans in which the accu-
mulated benefit obligation exceeds the fair value of plan assets.
PLANS WITH ASSETS LESS THAN ABO
December 31 (In millions) 2006 2005
Funded plans with assets less than ABO
Plan assets $4,833 $4,737
Accumulated benefi t obligations 5,828 6,096
Projected benefi t obligations 6,667 6,967
Unfunded plans(a)
Accrued pension liability 4,310 3,323
Accumulated benefi t obligations 3,052 2,859
Projected benefi t obligations 4,310 4,235
(a) Primarily related to the GE Supplementary Pension Plan.
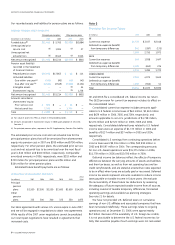
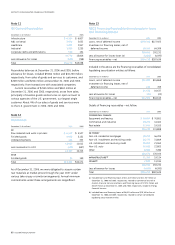
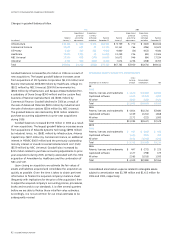
Pension plan assets are described below.
FAIR VALUE OF PLAN ASSETS
Principal pension plans Other pension plans
(In millions) 2006 2005 2006 2005
Balance at January 1 $49,096 $46,665 $5,213 $4,602
Actual gain on plan assets 7,851 4,558 679 670
Employer contributions 121 106 451 365
Participant contributions 162 174 37 36
Benefi ts paid (2,472) (2,407) (287) (256)
Exchange rate adjustments — — 340 (233)
Acquired plans and other — — 2 29
Balance at December 31 $54,758 $49,096 $6,435 $5,213
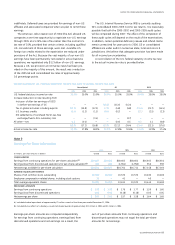
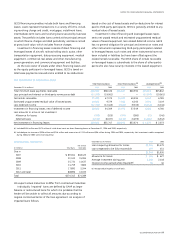
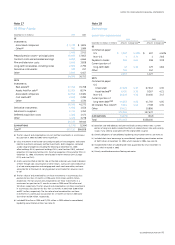
Our pension plan assets are held in trust, as follows:
PLAN ASSET ALLOCATION
Principal pension plans
2006 2005
Target Actual Actual
December 31 allocation allocation allocation
U.S. equity securities 30–45% 41% 42%
Non-U.S. equity securities 15–25 22 21
Debt securities 15–30 17 18
Real estate 4–10 6 6
Private equities 5–11 7 7
Other 1–12 7 6
Total 100% 100%
Plan fiduciaries of the GE Pension Plan set investment policies and
strategies for the GE Pension Trust. Long-term strategic invest-
ment objectives include preserving the funded status of the plan
and balancing risk and return. These plan fi duciaries oversee the
investment allocation process, which includes selecting investment
managers, commissioning periodic asset-liability studies, setting
long-term strategic targets and monitoring asset allocations.
Target allocation ranges are guidelines, not limitations, and occa-
sionally plan fiduciaries will approve allocations above or below a
target range.
GE Pension Trust assets are invested subject to the following
additional guidelines:
• Short-term securities must be rated A1/P1 or better, other
than 15% of short-term holdings which may be rated A2/P2,
• Real estate may not exceed 25% of total assets (6% of trust
assets at December 31, 2006),
• Investments in securities not freely tradable may not exceed
20% of total assets (13% of trust assets at December 31,
2006), and
• GE stock is limited by statute when it reaches 10% of total
trust assets (6.1% and 6.4% at the end of 2006 and 2005,
respectively).
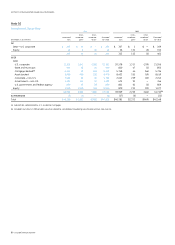
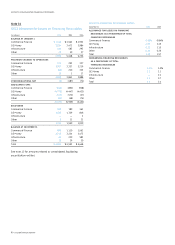
Other pension plans (weighted average)
2006 2005
Target Actual Actual
December 31 allocation allocation allocation
Equity securities 66% 67% 65%
Debt securities 28 26 28
Real estate 3 3 3
Other 3 4 4
Total 100% 100%
ge 2006 annual report 83