GE 2006 Annual Report Download - page 50
Download and view the complete annual report
Please find page 50 of the 2006 GE annual report below. You can navigate through the pages in the report by either clicking on the pages listed below, or by using the keyword search tool below to find specific information within the annual report.-
 1
1 -
2
-
3
-
4
-
5
-
6
-
7
-
8
-
9
-
10
-
11
-
12
-
13
-
14
-
15
-
16
-
17
-
18
-
19
-
20
-
21
-
22
-
23
-
24
-
25
-
26
-
27
-
28
-
29
-
30
-
31
-
32
-
33
-
34
-
35
-
36
-
37
-
38
-
39
-
 40
40 -
 41
41 -
 42
42 -
 43
43 -
 44
44 -
 45
45 -
 46
46 -
 47
47 -
 48
48 -
 49
49 -
 50
50 -
 51
51 -
 52
52 -
 53
53 -
 54
54 -
 55
55 -
 56
56 -
 57
57 -
 58
58 -
 59
59 -
 60
60 -
61
-
62
-
63
-
64
-
65
-
66
-
67
-
68
-
69
-
70
-
71
-
72
-
73
-
74
-
75
-
76
-
77
-
78
-
79
-
80
-
81
-
82
-
83
-
84
-
85
-
86
-
87
-
88
-
89
-
90
-
91
-
92
-
93
-
94
-
95
-
96
-
97
-
98
-
99
-
100
-
101
-
102
-
103
-
104
-
105
-
106
-
107
-
108
-
109
-
110
-
111
-
112
-
113
-
114
-
115
-
116
-
117
-
118
-
119
-
120
 |
 |

’
Operations
Our consolidated financial statements combine the industrial
manufacturing, services and media businesses of General Electric
Company (GE) with the financial services businesses of General
Electric Capital Services, Inc. (GECS or fi nancial services).
In the accompanying analysis of financial information, we
sometimes use information derived from consolidated fi nancial
information but not presented in our financial statements prepared
in accordance with U.S. generally accepted accounting principles
(GAAP). Certain of these data are considered “non-GAAP fi nancial
measures” under the U.S. Securities and Exchange Commission
(SEC) rules. For such measures, we have provided supplemental
explanations and reconciliations in the Supplemental Information
section.
We present Management’s Discussion of Operations in fi ve
parts: Overview of Our Earnings from 2004 through 2006, Global
Risk Management, Segment Operations, Global Operations and
Environmental Matters.
Overview of Our Earnings from 2004 through 2006
Our results over the last several years reflect the global economic
environment in which we operate. Global markets have been,
and remain, strong. Orders for products and services continue to
increase. Emerging markets continue to grow and to offer us
new opportunities. Abundant global liquidity is providing us capital
market opportunities, but reducing risk spreads. In these highly
competitive markets, we have, over the last three years, achieved
organic revenue growth averaging 8% and signifi cantly accelerated
our globalization. Revenues from our operations located outside
the United States plus all U.S. exports (global revenues) grew by
more than 60% over this period. We also experienced a weaker
U.S. dollar, escalating energy costs and higher fossil fuel-related
raw material prices. Our debt continues to receive the highest
ratings of the major rating agencies. As the following pages show,
our diversification and risk management strategies enabled us to
continue to grow revenues and earnings to record levels during
this challenging time.
Of our six segments, Infrastructure (28% and 34% of consoli-
dated three-year revenues and total segment profi t, respectively)
was one of the most significantly affected by the recent economic
environment. During these years we invested in other lines of
power generation, such as wind power, and developed product
services. As a result, Energy revenues have grown signifi cantly
over these years and the business is positioned well for continued
growth in 2007 and beyond. We also continued to invest in
market-leading technology and services at Aviation, Water and
Transportation. At December 31, 2006, we had 1,419 commercial
aircraft, of which all but one were on lease, and we held $14.0 billion
(list price) of multiple-year orders for various Boeing, Airbus and
other aircraft, including 63 aircraft ($4.3 billion list price) scheduled
for delivery in 2007, all under agreement to commence operations
with commercial airline customers. Product services and sales of
our Evolution Series locomotives continue to be strong.
Commercial Finance and GE Money, formerly Consumer Finance,
(together, 27% and 32% of consolidated three-year revenues and
total segment profit, respectively) are large, profi table growth
businesses in which we continue to invest with confidence. In a
competitive environment, these businesses grew earnings by a
combined $1.2 billion and $1.3 billion in 2006 and 2005, respec-
tively. Commercial Finance and GE Money have delivered strong
results through solid core growth, disciplined risk management
and successful acquisitions. The most signifi cant acquisitions
affecting Commercial Finance and GE Money results in 2006
were the custom fleet business of National Australia Bank Ltd.;
Antares Capital Corp.; the Transportation Financial Services Group
of CitiCapital; and joint ventures with Garanti Bank and Hyundai
Card Company. These acquisitions collectively contributed
$0.9 billion and $0.3 billion to 2006 revenues and net earnings,
respectively.
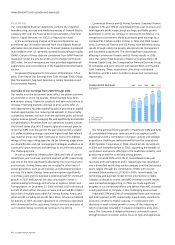
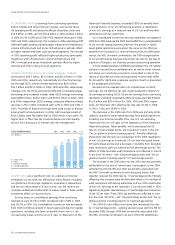
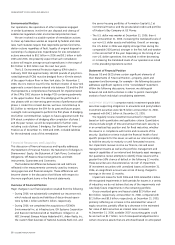
CONSOLIDATED REVENUES 2002 2003 2004 2005 2006
(In $ billions) 163
148
134
112 113
A. GECS Revenues
B. GE Revenues
We have achieved strong growth in Healthcare (10% and 12%
of consolidated three-year revenues and total segment profi t,
respectively) with a combination of organic growth and strategic
acquisitions. Healthcare realized benefits from the acquisitions
of IDX Systems Corporation in 2006, Amersham plc (Amersham)
in 2004 and Instrumentarium in 2003, expanding the breadth of
our product and service offerings to the healthcare industry, and
positioning us well for continued strong growth.
NBC Universal (10% and 12% of consolidated three-year
revenues and total segment profi t, respectively) has developed
into a diversified world-class media company over the last several
years, largely through the combination of NBC with Vivendi
Universal Entertainment LLLP (VUE) in 2004. Nevertheless, the
technology and business model for the entertainment media
industry continues to evolve, and NBC Universal’s recent results
were somewhat disappointing. In 2006, we made signifi cant
progress in our turnaround efforts and believe that NBC Universal
is well positioned to compete in this challenging environment.
Industrial (22% and 10% of consolidated three-year revenues
and total segment profit, respectively) is particularly sensitive to
economic conditions. Higher capacity, in combination with
declining or weak volume growth in many of the industries in
which it operates, resulted in increased competitive price pres-
sures. The Consumer & Industrial business continued to grow
through product innovation and its focus on high-end appliances.
48 ge 2006 annual report