GE 2006 Annual Report Download - page 100
Download and view the complete annual report
Please find page 100 of the 2006 GE annual report below. You can navigate through the pages in the report by either clicking on the pages listed below, or by using the keyword search tool below to find specific information within the annual report.-
 1
1 -
2
-
3
-
4
-
5
-
6
-
7
-
8
-
9
-
10
-
11
-
12
-
13
-
14
-
15
-
16
-
17
-
18
-
19
-
20
-
21
-
22
-
23
-
24
-
25
-
26
-
27
-
28
-
29
-
30
-
31
-
32
-
33
-
34
-
35
-
36
-
37
-
38
-
39
-
40
-
41
-
42
-
43
-
44
-
45
-
46
-
47
-
48
-
49
-
50
-
51
-
52
-
53
-
54
-
55
-
56
-
57
-
58
-
59
-
60
-
61
-
62
-
63
-
64
-
65
-
66
-
67
-
68
-
69
-
70
-
71
-
72
-
73
-
74
-
75
-
76
-
77
-
78
-
79
-
80
-
81
-
82
-
83
-
84
-
85
-
86
-
87
-
88
-
89
-
 90
90 -
 91
91 -
 92
92 -
 93
93 -
 94
94 -
 95
95 -
 96
96 -
 97
97 -
 98
98 -
 99
99 -
 100
100 -
 101
101 -
 102
102 -
 103
103 -
 104
104 -
 105
105 -
 106
106 -
 107
107 -
 108
108 -
 109
109 -
 110
110 -
111
-
112
-
113
-
114
-
115
-
116
-
117
-
118
-
119
-
120
 |
 |

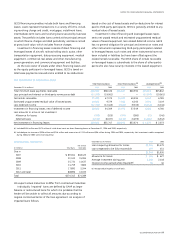
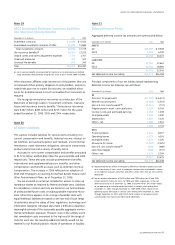
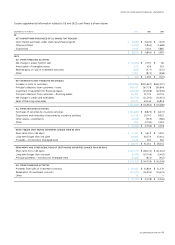
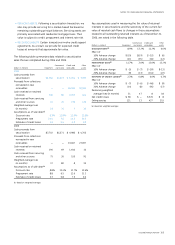
STOCK OPTION ACTIVITY
Weighted
average
Weighted remaining Aggregate
average contractual intrinsic
Shares exercise term value
(in thousands) price (in years) (in millions)
Outstanding at
January 1, 2006(a) 259,116 $33.07
Granted 20,464 34.00
Exercised (35,335) 17.52
Forfeited (4,453) 32.46
Expired (7,372) 41.84
Outstanding at
December 31, 2006 232,420 $35.25 4.7 $1,040
Exercisable at
December 31, 2006 183,217 $35.93 3.8 $ 818
Options expected to vest 43,994 $32.61 8.1 $ 202
(a) Included 1.2 million options with a weighted average exercise price of $21.81
related to various acquisitions.
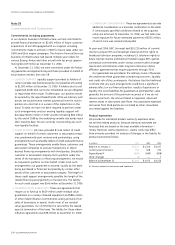
We measure the fair value of each stock option grant at the date
of grant using a Black-Scholes option pricing model. The weighted
average grant-date fair value of options granted during 2006,
2005 and 2004 amounted to $7.99, $8.87 and $8.33, respectively.
The following assumptions were used in arriving at the fair value
of options granted during 2006, 2005 and 2004, respectively:
risk-free interest rates of 4.8%, 4.1% and 4.0%; dividend yields of
2.9%, 2.5% and 2.5%; expected volatility of 24%, 28% and 28%;
and expected lives of six years and two months, six years and
six years. Risk free interest rates reflect the yield on zero-coupon
U.S. Treasury securities. Expected dividend yields presume a
set dividend rate. Expected volatilities are based on implied
volatilities from traded options and historical volatility of our stock.
The expected option lives are based on our historical experience
of employee exercise behavior.
The total intrinsic value of options exercised during 2006,
2005 and 2004 amounted to $1,312 million, $731 million and
$958 million, respectively. As of December 31, 2006, there was
$200 million of total unrecognized compensation cost related to
nonvested options. That cost is expected to be recognized over
a weighted average period of three years and 11 months.
Cash received from option exercises during 2006, 2005 and
2004 was $622 million, $403 million and $459 million, respectively.
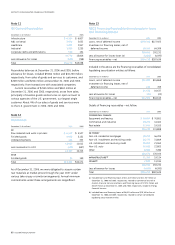
RSU ACTIVITY
Weighted
average
remaining Aggregate
contractual intrinsic
Shares term value
(in thousands) (in years) (in millions)
Outstanding at January 1, 2006
Granted
Vested
Forfeited
33,078
9,167
(4,879)
(3,039)
Outstanding at December 31, 2006 34,327 5.6 $1,277
RSUs expected to vest 30,972 4.9 $1,152
The fair value of each restricted stock unit is the market price of
our stock on the date of grant. The weighted average grant-
date fair value of RSUs granted during 2006, 2005 and 2004
amounted to $33.95, $34.72 and $32.47, respectively. The total
intrinsic value of RSUs vested during 2006, 2005 and 2004
amounted to $132 million, $90 million and $85 million, respec-
tively. As of December 31, 2006, there was $535 million of total
unrecognized compensation cost related to nonvested RSUs.
That cost is expected to be recognized over a weighted average
period of four years and 11 months.
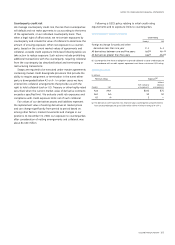
PSU activity
As of December 31, 2006, 1.4 million PSUs with a weighted
average remaining contractual term of two years, an aggregate
intrinsic value of $51 million and $18 million of unrecognized
compensation cost were outstanding.
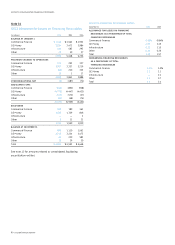
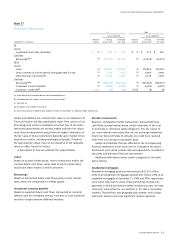
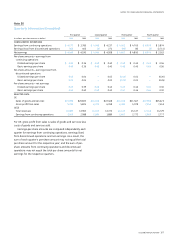
Note 25
Supplemental Cash Flows Information
Changes in operating assets and liabilities are net of acquisitions
and dispositions of principal businesses.
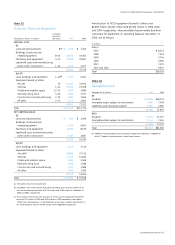
Amounts reported in the “Payments for principal businesses
purchased” line in the Statement of Cash Flows is net of cash
acquired and included debt assumed and immediately repaid in
acquisitions.
Amounts reported in the “All other operating activities” line
in the Statement of Cash Flows consists primarily of adjustments
to current and noncurrent accruals and deferrals of costs and
expenses, adjustments for gains and losses on assets, increases
and decreases in assets held for sale and adjustments to assets.
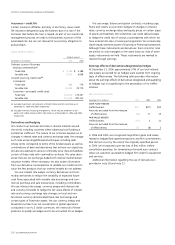
Significant non-cash transactions include the following: In 2006,
in connection with our sale of GE Insurance Solutions, Swiss Re
assumed $1,700 million of debt, and GE received $2,238 million
of newly issued Swiss Re common stock. See note 2. In 2005,
NBC Universal acquired IAC/InterActiveCorp’s 5.44% common
interest in VUE for a total purchase price that included $115 million
of non-cash consideration, representing the fair value of future
services to be performed by NBC Universal; and in 2004, the
issuance of GE common stock valued at $10,674 million in
connection with the acquisition of Amersham and the issuance
of NBC Universal common stock valued at $5,845 million in
connection with the combination of NBC and VUE.
98 ge 2006 annual report